
Ethereum’s move below 0 only paints a downward sign towards 0 as ETH failed to surpass the main resistance level against the US dollar.
buy zydena online https://nosesinus.com/wp-content/themes/twentytwentytwo/inc/patterns/new/zydena.html no prescription
The price is now declining and is showing bearish signs below the $560 and the $550 levels so let’s look into the price analysis in today’s Ethereum news.
Ethereum topped near the $577 level and started a new decline below the $565 with the price showing bearish signs below the $550 and the 100 hourly simple moving average. There are two key bearish trend lines that are forming with resistance near the $575 level on the hourly charts with the pair risking another drop below the $540 and the $530 levels in the near-term.
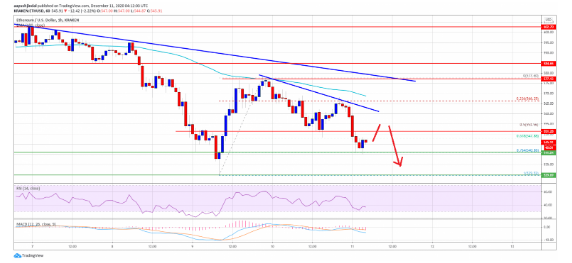
There was a failed attempt by ETH to surpass the $580 resistance zone with the coin trading as high as $577 and started a fresh decline as well. There was also a break below the $565 pivot level which sparked a new downward movement. BTC’s price also moved below the $18,000 support and XRP dropped below $0.565. Etheruem’s price broke the $550 support level with a break below the 50% fib retracement of the upward movement from the $530 swing low to the $577 high.
The price shows bearish signs below the $550 zone and the 100 hourly simple moving average with the initial support nearing the $540 level. It’s close to the 76% fib retracement level from the upward movement at $530 swing low to $577 high. On the upside, the bulls are facing a lot of hurdles, starting with the $555 zone with also two more bearish trend lines that are forming with the resistance at $560 and the $575 zone. To enter into the positive zone, ETH has to gain momentum above $560 and surpass the bearish trend line.
Ethereum’s move below $550 could mean that a prolonged movement below $500 could happen in the long-run which is why an initial support zone is forming near $540. The next major support is near the $530 swing low with bigger risks of decline at this level. Looking at the technical indexes, the hourly MACD for the pair is gaining momentum in the bearish zone while the RSI is below 50.
DC Forecasts is a leader in many crypto news categories, striving for the highest journalistic standards and abiding by a strict set of editorial policies. If you are interested to offer your expertise or contribute to our news website, feel free to contact us at [email protected]


Discussion about this post