
Tezos presents a crucial buying signal while trying to break the all-time highs for the first time in three months as we can see in today’s tezos price news.
Tezos’ downtrend seems to have reached exhaustion after the 50% correction but if history repeats itself, XTZ’s price will double in the next few months. Hitting the $2.8 resistance level into support level will only add more credence to the bullish outlook. Despite the market-wide downturn, technicals show that there’s a huge opportunity to purchase Tezos. The bullish patterns show that XTZ has the potential to hit all-time highs.
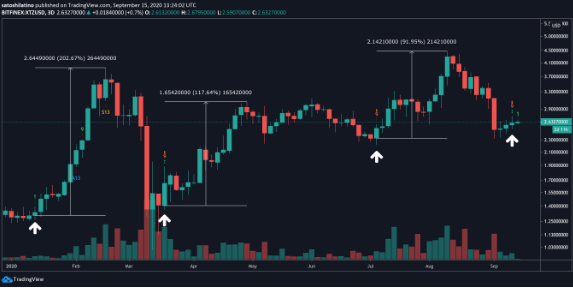
Tezos experienced a huge correction after rising to the new all-time highs of $4.5 as its price got cut in half in the past month when XTZ reached a new low of $2.3. Despite the significant losses incurred, the technical index shows that the cryptocurrency could reverse from bearish to bullish. Tezos presents a crucial buying signal on the 3-day charts. the formation developed a red nine candlestick which indicates a start of an upswing or a new upward countdown. A green two candlestick trading above the current green could serve as a confirmation of the optimistic outlook.
Based on the historical data, the TD index was accurate at predicting the local bottoms of the altcoin. Each buys signal that this technical index presented since 2020 stared, was validated at the end, and led to huge gains. The current forecast has to be taken seriously despite the level of uncertainty in the market. The 12-hour chart added credence to this idea that a decent price movement is upcoming. Within the timeframe, the Bollinger bands were forced to squeeze as many technical analysts see these squeezes as a consolidation pattern which is succeeded by high levels of volatility. if the squeeze is longer, the more violent the breakout that follows will be.
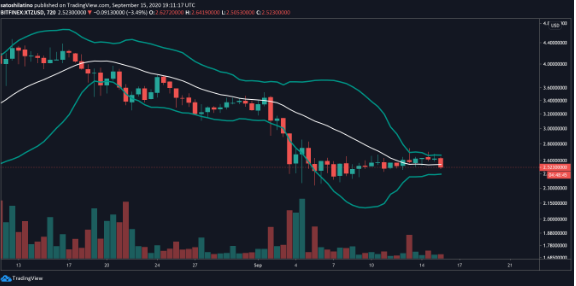
The Bollinger Bands’ inability to provide a clear path for the Tezos’ market direction between the lower and upper band is in a reasonable no-trade zone. Looking at the Fibonacci retracement zone, the critical area of interest expands to the 78% fib level with a swing low of $2.3. going past this overhead resistance will validate the bullish scenario that is presented by the TD Sequential indicator.
The next crucial level of resistance could be 50% and 38% fib levels. These hurdles sit at $3.4 and $3.7 but If the demand is stronger, the prices could double as they have done once before. The downswing that pushed XTZ below the low of $2.3 could jeopardize the optimistic view so it could even trigger a panic selling mode for the investors as the cryptocurrency will be making lower lows for the first time in two years.
DC Forecasts is a leader in many crypto news categories, striving for the highest journalistic standards and abiding by a strict set of editorial policies. If you are interested to offer your expertise or contribute to our news website, feel free to contact us at [email protected]


Discussion about this post