
A BTC indicator suggests that the cryptocurrency is slowly reaching overheated levels as the entire market was caught within a firm uptrend as of late. The uptrend transformed into a consolidation over the past few days so let’s check up on the latest BTC price news and analysis.
BTC and its smaller counterparts started trading sideways as of late with the bears trying to gain an edge over the bulls which slowly pushed the cryptocurrency lower. Where will the market trend in the near-term will depend largely on whether or not BTC is able to surmount $40,000 once again. The selling pressure was so strong here but the bulls were able to establish support below this level. One trader believes that the BTC indicator suggests the rally enters the overheated territory. BTC and the rest of the market struggled to gain massive momentum over the past few days.
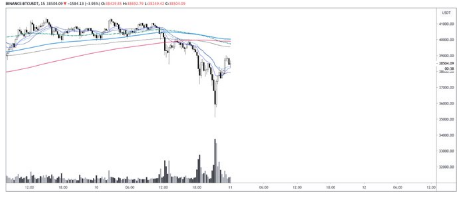
BTC has been consolidating near the $40,000 level and it is now in the process of dropping lower as the bulls try to thwart another retrace. Where will the entire market trend next depends on whether the bulls are able to protect against any intense selloff. One on-chain analyst thinks that BTC will be hit with a pullback as he noted the ongoing rally is showing some signs of exhaustion.
At the time of writing, BTC is trading down at just over 2% with a current price of $39,350. This is around the same price level that it was trading over the past few days. BTC had been holding above $40,000 over the second part of the week but today’s break below this level outlines some underlying weakness. Where will the market trend in the near-term depends on whether or not the bulls are able to reclaim this level and flip it into support.
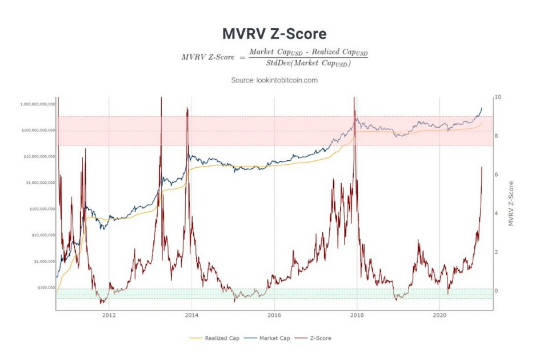
Another on-chain analyst pointed to Bitcoin’s MVRV Z score which provides more insight into where the asset is within a market cycle. This indicator suggests that the primary cryptocurrency could see a pullback in the near-term before another parabolic increase occurs:
“I am starting to feel that the market is approaching overheated levels now. One data point to observe is MVRV Z-score, which looks at extremes in the data sets between Market Value and Realised Value… We can see that when the z-score enters the red zone it signals a market top. We are not there yet but a few more parabolic days up for price and we will be.”
DC Forecasts is a leader in many crypto news categories, striving for the highest journalistic standards and abiding by a strict set of editorial policies. If you are interested to offer your expertise or contribute to our news website, feel free to contact us at [email protected]


Discussion about this post