
The Bitcoin news today show us that BTC could decline further and retrace below $9,000 if the weak momentum continues. The cryptocurrency started a strong decline after it broke the key $9,500 support against the US dollar. The price of BTC is now correcting higher from the $8,794 low but the upsides are likely to remain capped.
At press time, Bitcoin is trading at $9,095 and well below the $9,250 pivot level and the 100 hourly simple moving average. We can notice a key connecting bearish trend line forming with resistance near $9,220 on the hourly chart of the BTC/USD pair.
Anyways, BTC could decline further if it loses the upward momentum. We could see a sharp slide below the $9,250 and $9,150 support levels – and the coin even dived below $9,000 and settled well below the 100 hourly simple moving average. It traded to a new weekly low at $8,794 before starting an upside correction.
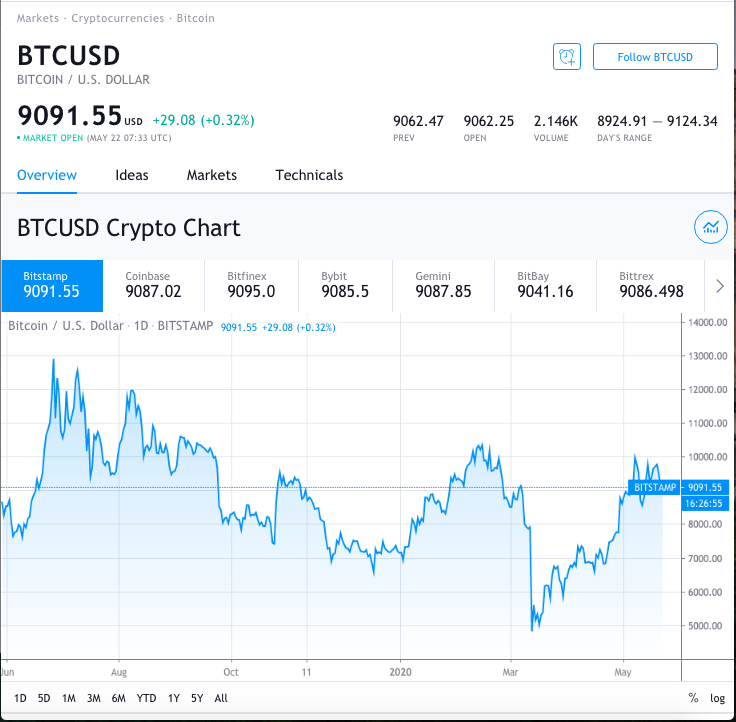
Also, the price of Bitcoin recovered above the $9,000 resistance level – it also managed to recover above the 23.6% Fib retracement level of the recent slide from the $9,842 high to a $8,794 low.
On the upside, there are so many hurdles forming near the ,220, ,250 and ,300 levels.
buy light pack generic buy light pack online no prescription
There is also a major connecting bearish trend line forming with resistance near $9,220 on the hourly chart of the BTC/USD pair as the chart from TradingView shows us.
Anyways, this trend line is close to the 50% Fib retracement level of the recent slide to the low of $8,794. Therefore, the price of BTC could decline after it faces strong selling interest near the $9,220, $9,250 and $9,300 levels in the near term.
The math is simple – if Bitcoin fails to correct above $9,150 and $9,250 in the cryptocurrency news, it is very likely to continue lower triggered by its weak momentum. An initial support on the downside is placed near the $9,000 level.
However, a daily close below the $9,000 level might start another bearish wave, and the next key support is near the $8,800 level, below which the price is likely to dive towards the $8,500 support zone. Any further losses may lead the price towards $8,200. The technical indicators are now as following:
- Hourly MACD – The MACD is now in the bullish zone but could turn bearish again.
- Hourly RSI (Relative Strength Index) – The RSI for BTC/USD is now recovering towards the 45 level.
- Major Support Levels – $9,000 followed by $8,800.
- Major Resistance Levels – $9,130, $9,250 and $9,300.
DC Forecasts is a leader in many crypto news categories, striving for the highest journalistic standards and abiding by a strict set of editorial policies. If you are interested to offer your expertise or contribute to our news website, feel free to contact us at [email protected]


Discussion about this post