



The bitcoin vs stocks debate has a fresh number behind it. Over the 30 trading sessions to November 5, bitcoin’s daily moves tracked the S&P 500 more closely than at any point in 2026, with a correlation of 0.74.
That reading comes from a DCForecasts analysis of a full year of daily closes, and it lands at an awkward moment. Bitcoin has been moving with Wall Street day to day, yet it sits about 13% below where it started the year while the S&P 500 is up roughly 7%.
That gap is the most interesting part of the story. When two assets move together this tightly but one has lagged badly, the next broad turn in risk appetite tends to matter more for the laggard.
How We Measured the Bitcoin and Stock Market Link
We matched bitcoin’s daily US dollar price from CoinGecko with S&P 500 and Nasdaq Composite closing levels from the Federal Reserve Bank of St. Louis FRED database. The sample covers 249 trading days, from November 10, 2025 to November 5, 2026.
Because bitcoin trades around the clock, we used its 00:00 UTC price, about three hours after the New York close, as that day’s close. We then compared daily percentage changes, not price levels, since price levels can look linked even when daily moves are not.
A correlation of 1 means the two move in perfect step. Zero means no consistent link at all. Over the full year, bitcoin’s correlation with the S&P 500 was 0.47, and with the Nasdaq it was 0.48. That is a meaningful link, but far from lockstep.
Bitcoin vs S&P 500: A 2026 High at 0.74
The 30-day reading is where the picture sharpens. It dipped as low as 0.08 on May 13, when bitcoin largely ignored equities. It then rebuilt through the autumn, crossed 0.6 in early October and reached 0.74 on November 5.
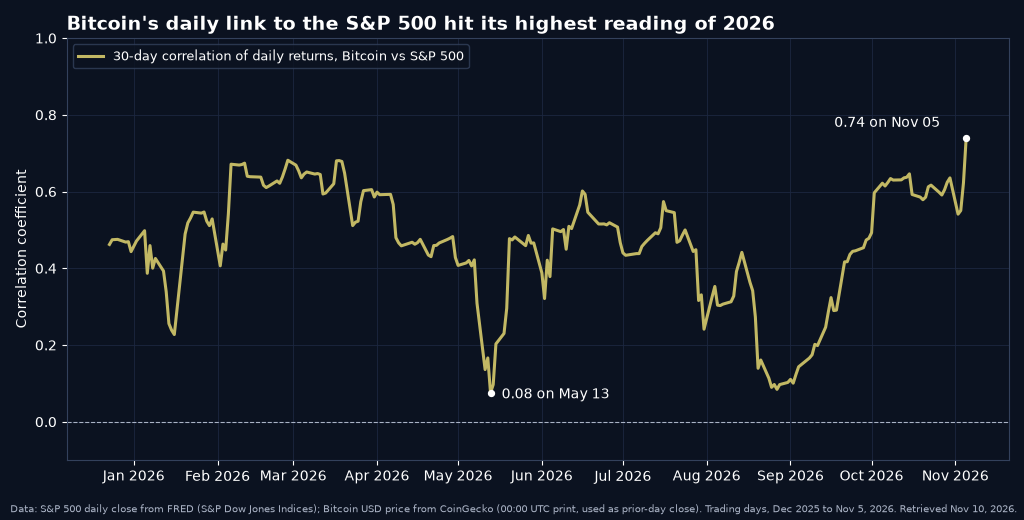
November 5 itself shows why. The S&P 500 fell 4.4% that day, from 7,688.62 to 7,353.73, in the sell-off we covered in our report on stocks nearing circuit-breaker levels. Bitcoin dropped about 5.5% over the same window, from roughly $80,440 to about $76,010.
The pattern holds on the biggest equity days of the year. The S&P 500 moved more than 2% in either direction on five sessions in 2026, and bitcoin moved the same way on four of them.

Why Is Bitcoin Trading Like a Tech Stock?
A tight short-term link usually says more about who is trading than about what bitcoin is. Much of the marginal buying and selling now runs through US spot ETFs, brokerages and macro funds that hold bitcoin next to equities and size positions on the same risk dials.
When those investors cut exposure, they tend to trim everything at once. We looked at that flow side in our outlook on whether Wall Street can help BTC recover, which tracked about $1.28 billion of spot ETF outflows in the first week of November.
The intensity differs, though. Over the 30 sessions to November 5, bitcoin’s sensitivity to the S&P 500, known as beta, was about 1.3. In plain terms, a 1% move in the index came with an average bitcoin move of roughly 1.3% in the same direction.
Same Direction, Very Different Scorecards
Here is the twist. Moving together day to day has not meant ending up in the same place. From December 31, 2025 to November 5, bitcoin fell 13.2%, while the S&P 500 gained 7.4% and the Nasdaq Composite added 4.6%.
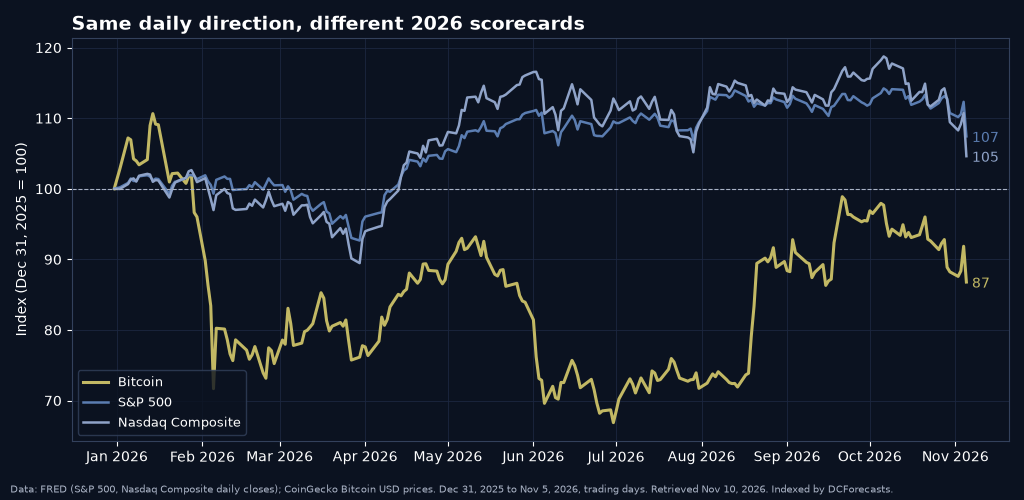
The gap opened in sharp bursts rather than slowly. Bitcoin took a heavy hit in late January and another from late May into June. Each time, it later recovered a large share of the ground, including a strong run from mid-August into late September.
Across all 249 days, the asymmetry is clear. On days the S&P 500 rose, bitcoin gained 0.90% on average against 0.64% for the index. On down days, bitcoin lost 1.17% against the index’s 0.63%.
Bitcoin captured more of the upside, but it gave back even more on the way down. That explains how a positive link can still leave it trailing over the year.
What the Stock Market Link Means for Bitcoin Holders
We see a constructive side to a high correlation. Bitcoin has already absorbed a deeper drawdown than stocks this year. If equities steady, the same link that dragged it lower can work in reverse, and with a beta above 1.
The calendar adds a near-term test. The Bureau of Labor Statistics is scheduled to publish October CPI on November 10 at 8:30 a.m. Eastern time, according to its official release schedule. We set out what to watch in our preview of the core CPI figure.
A calm print that eases pressure on stocks would put this link to work for bitcoin. A hot one could test it in the other direction.
A few limits keep this in perspective. Correlation describes the past, not the future, and 30-day readings can swing quickly, as May showed. Bitcoin was also about 43% volatile on an annualized basis over the full sample, roughly three times the S&P 500’s 14%.
That volatility cuts both ways, and position sizing still matters more than any single statistic.
The Bottom Line
Bitcoin is trading closer to the stock market than at any point this year, and it has done so while carrying a deficit of roughly 20 percentage points against the S&P 500. With bitcoin near $74,900 early on November 10, the bitcoin vs stocks gap is wide and the daily link is strong.
That combination leaves bitcoin well placed to benefit if risk appetite turns. There are no guarantees, but this year’s data show bitcoin has recovered ground quickly once the tide shifted.
DC Forecasts is a leader in many crypto news categories, striving for the highest journalistic standards and abiding by a strict set of editorial policies. If you are interested to offer your expertise or contribute to our news website, feel free to contact us at [email protected]












Discussion about this post