



Bitcoin volatility has a reputation that is hard to shake. Yet in the first weeks of November, the gap between how much Bitcoin swings and how much U.S. stocks swing shrank to its narrowest level in the past year.
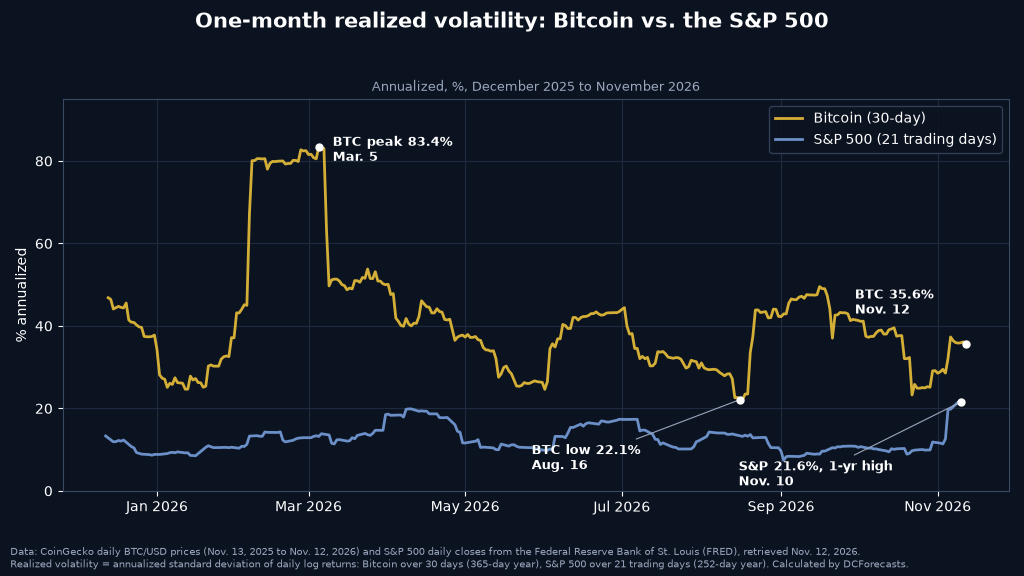
On Nov. 10, Bitcoin’s one-month realized volatility was 1.67 times that of the S&P 500, according to our calculations from CoinGecko and Federal Reserve Bank of St. Louis data. Five days earlier, on Nov. 5, the ratio hit 1.63, the lowest reading since our comparison begins in mid-December 2025.
For context, the same ratio stood at 6.68 on Feb. 20. Bitcoin is still the more volatile asset, but the distance between the two has fallen sharply.
How We Measured Bitcoin Volatility
Realized volatility measures how much a price actually moved, not how much traders expect it to move. We took the daily percentage changes in each asset’s price and annualized their standard deviation.
For Bitcoin, which trades every day, we used a 30-day window and a 365-day year. For the S&P 500, which trades only on weekdays, we used 21 trading days and a 252-day year. Both windows cover roughly one calendar month, so the figures can be compared directly.
By that measure, Bitcoin’s volatility was 35.6% on Nov. 12. That is below its median of 39.3% over the past year, and far below the 83.4% peak it reached on March 5.
Stocks Got Jumpier While Bitcoin Stayed in Its Range
The narrowing has come mostly from the stock side. The S&P 500’s one-month realized volatility climbed to 21.6% on Nov. 10, its highest level in the past 12 months and well above its one-year median of 12.2%. As recently as Nov. 4 it was 12.6%.
The index closed at 7,520.93 on Nov. 10, down 3.8% from its Oct. 6 high of 7,818.93, according to FRED data. The VIX, Wall Street’s main gauge of expected stock volatility, jumped to 28.18 on Nov. 5 before easing to 19.46 by Nov. 10.
Bitcoin’s volatility did rise too, from 29.5% on Nov. 3 to around 36% this week, as the price slipped from about $83,690 on Oct. 12 to near $73,970 on Nov. 12. But that is an ordinary reading for Bitcoin. Its volatility was higher than today on most days of the past year.

In other words, the same macro pressure that has pushed stocks well outside their usual range has left Bitcoin inside its own. We see that as a sign of an asset with a deeper and more stable holder base than in past cycles.
November Has the Lowest Monthly Ratio in Our Data
Averaging the daily ratio by month makes the trend easier to see. February was the most extreme month, when Bitcoin was on average 5.64 times as volatile as the S&P 500. September also stood out at 4.77 times.
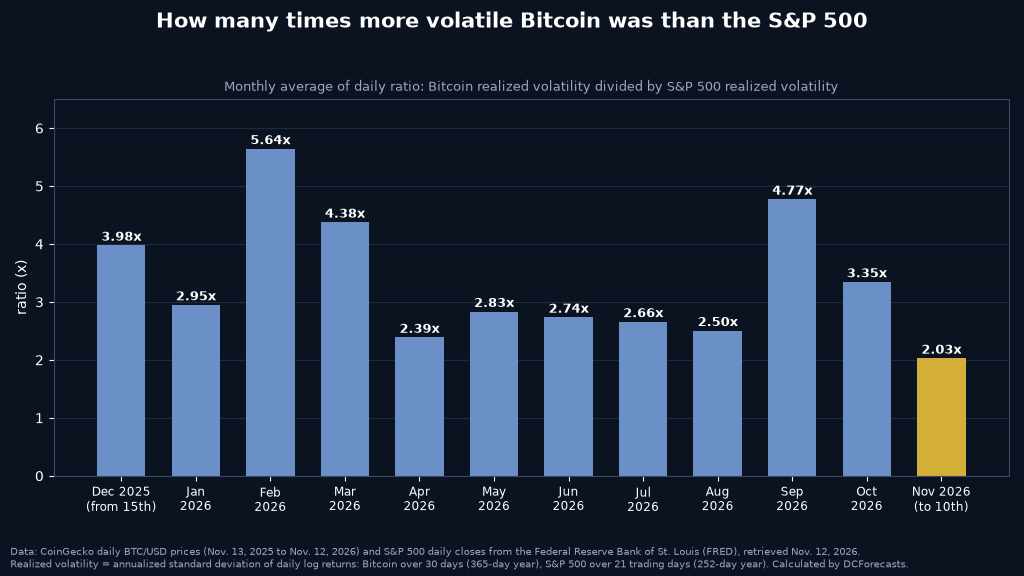
From April through August, the ratio settled between about 2.4 and 2.8 times. So far in November, through Nov. 10, it has averaged 2.03 times, the lowest monthly figure in our data.
That matters for investors who size positions by risk. Many portfolio models give each asset a weight based on its volatility. When Bitcoin’s volatility gets closer to that of equities, the same risk budget allows a larger Bitcoin allocation.
What This Means for Investors
Lower relative volatility does not mean Bitcoin has stopped moving. A 35.6% annualized figure still implies much larger swings than most stock indexes produce in normal times, and the ratio can rise again quickly if equities calm down.
But the trend lines up with other signals we have tracked this month. Bitcoin’s link to the S&P 500 reached a 2026 high, as we covered in our look at Bitcoin’s tie to the S&P 500. At the same time, our analysis of the positive Bitcoin funding rate showed derivatives traders stayed constructive through the slide toward $73,000.
We also noted that Bitcoin was holding just above its 200-day moving average, and that daily outflows from Bitcoin ETFs have been getting smaller.
Taken together, these readings describe a market that is under pressure but not panicking. Bitcoin’s swings this month have been in line with its normal range, while stocks have had their most volatile stretch in a year.
The Levels We Are Watching
- The ratio near 1.6. A move below the Nov. 5 low of 1.63 would set a new low for the past year.
- Bitcoin’s 39% median. As long as Bitcoin’s one-month volatility stays below its one-year median, the selling looks orderly.
- The S&P 500’s 21.6% reading. If stock volatility keeps rising while Bitcoin’s holds steady, the gap could narrow further.
Bitcoin is not yet as calm as the stock market, and we do not expect it to be soon. But November’s data shows the distance between the two shrinking at a time of real market stress, and we think that strengthens the case for Bitcoin as a long-term portfolio asset.
DC Forecasts is a leader in many crypto news categories, striving for the highest journalistic standards and abiding by a strict set of editorial policies. If you are interested to offer your expertise or contribute to our news website, feel free to contact us at [email protected]












Discussion about this post