



The Bitcoin 200 day moving average has acted as a floor for nearly three months, and it is about to be tested again. Bitcoin has closed every daily reading above that line since August 20, a run of 82 days.
The cushion is now thin. At about $74,600 on November 10, Bitcoin traded roughly 2% above its 200-day average of $73,150, based on our calculations from CoinGecko daily prices.
That gap was close to 23% in late September. The pullback since then has eaten most of it.
For long-term holders, this is the level that separates a healthy reset from a deeper trend change. The big question is whether buyers defend it once more.
Why the 200-Day Average Matters
The 200-day simple moving average is the average closing price of the last 200 days. It smooths out daily noise and shows the direction of the broader trend.
Many traders and funds use it as a dividing line. Above it, the trend is usually treated as constructive. Below it, many systematic strategies reduce risk.
That is why the line can become self-reinforcing. When enough investors watch the same level, buying often appears near it.
For this analysis, we used CoinGecko’s daily Bitcoin prices for the past year and calculated simple 50-day and 200-day averages ourselves. Daily readings are taken at 00:00 UTC, so intraday swings can briefly cross the line without changing the picture.
What the Data Shows Since August
The current run began on August 20, when Bitcoin closed near $69,290 against a 200-day average of about $68,980. It has not slipped below the line on a daily basis since.

The average itself has turned around. It bottomed on August 22 at about $68,950 and has since risen about 6% to $73,150.
That shift matters more than the price alone. In late May the average stood near $79,950 and was falling. A rising 200-day line points to an uptrend that is still in place.
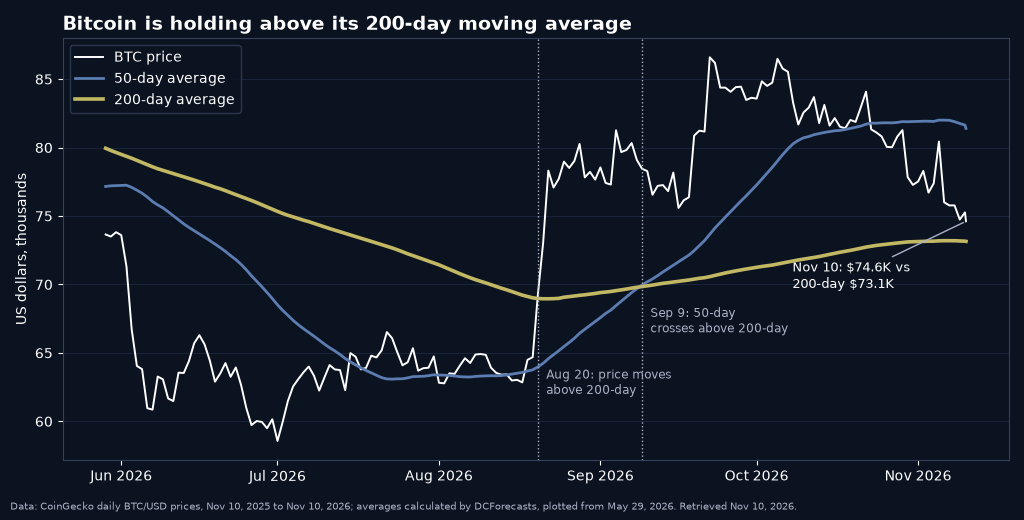
The faster 50-day average also crossed above the 200-day on September 9. Traders call that a golden cross, and it remains in place today.
The weaker reading is short-term. The 50-day average sits near $81,400, about 8% above the current price, and it has started to roll over in recent sessions.
The Mayer Multiple Has Cooled to 1.02
Another way to see the same picture is the Mayer Multiple, a ratio created by investor Trace Mayer. It divides Bitcoin’s price by its 200-day moving average.
A reading of 1.0 means price sits exactly on the average. Readings far above it have historically pointed to overheating, while readings below 1.0 have marked periods of weakness.
Our calculation puts the multiple at 1.02. It peaked at 1.23 on September 22 and hit a low of 0.77 on June 6, during the summer slide.
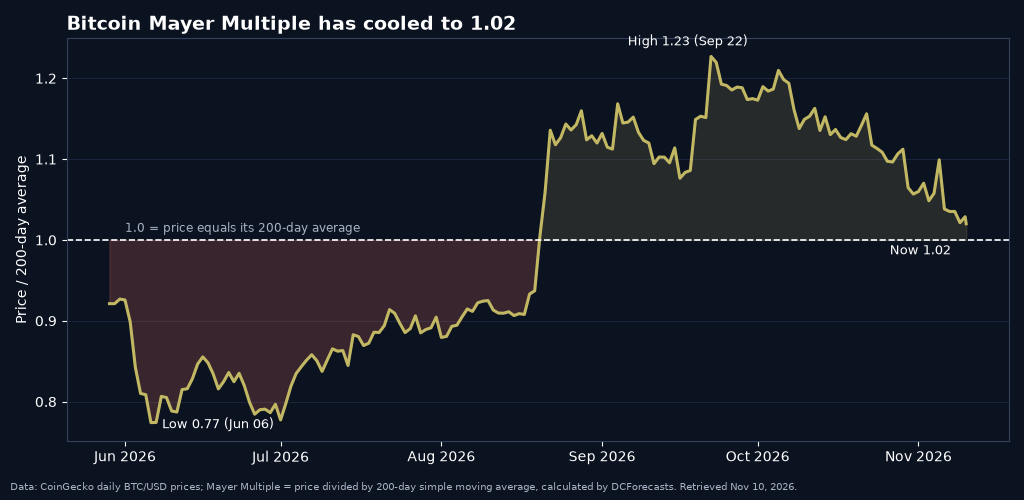
We read this as a market that has shed its excess without breaking its trend. A multiple near 1.0 is a long way from the stretched levels that tend to come before major tops.
It also means the margin for error is small. A daily close below roughly $73,150 would push the multiple under 1.0 for the first time since August.
How the Recent Pullback Fits
Bitcoin has eased from the mid-$80,000s in early October. The latest leg lower came as technology stocks sold off, and DCForecasts covered how a brief dip to $73,477 was bought back within 75 minutes.
That reaction happened right above the 200-day average. In our view, it is an early sign that buyers are watching this zone closely.
The wider context is also more stable than in past cycles. We have shown that bear market drawdowns have shrunk across three cycles and that Bitcoin’s volatility has nearly halved since 2021.
Still, the honest picture includes the larger move. Bitcoin is about 30% below the $105,950 level recorded on November 11, 2025. It is also about 27% above its July 1 low near $58,570.
Levels to Watch From Here
The first level is the 200-day average itself, now near $73,150. Holding above it on daily closes keeps the trend structure intact.
The second is the 50-day average near $81,400. Reclaiming that line would suggest the pullback has run its course.
In between sit the September and October trading ranges, which held for weeks in the high $70,000s and low $80,000s.
We would also keep an eye on how the 200-day line itself behaves. If it keeps rising, every week of sideways trading lifts the floor a little higher.
US inflation data and the direction of large tech stocks remain the main outside drivers. Both have moved Bitcoin in recent sessions.
A softer inflation print would support the case for lower interest rates, which has tended to help risk assets. A hotter one could add pressure right at the moment Bitcoin is testing its trend line.
A Test That Bitcoin Has Passed Before
Retests of the 200-day average are a normal part of healthy uptrends. They shake out short-term leverage while long-term demand stays in place.
We believe Bitcoin’s fixed supply, growing institutional ownership and maturing market structure give this level a stronger base than in earlier cycles.
The coming sessions will show whether the floor that has held for 82 days holds again. If it does, investors may soon start looking back toward $81,000 and above.
DC Forecasts is a leader in many crypto news categories, striving for the highest journalistic standards and abiding by a strict set of editorial policies. If you are interested to offer your expertise or contribute to our news website, feel free to contact us at [email protected]












Discussion about this post