



Bitcoin is having one of its roughest weeks of the year, but one strategist sees a bullish setup under the surface. James Thorne, chief market strategist at Canadian wealth manager Wellington-Altus, argues that the 2026 price action has traced out an inverse head-and-shoulders pattern, a classic reversal shape. Thorne, who lists a PhD in economics on his X profile, says that if the pattern plays out, it puts bitcoin on a path to $117,000 by mid-2027 and a new all-time high after that.
“Bitcoin: is the bottom in? Does a new all time high come in 2027?” Thorne asked in a post on X on November 14. His answer came as a step-by-step roadmap: “Reclaim $73k. Confirm above $87k. Target $117k by mid-2027, then a break of the $126k high.”
The pattern Thorne is watching
An inverse head-and-shoulders forms when price makes three lows, with the middle one the deepest. The two outer lows are the “shoulders,” and the middle one is the “head.” A line across the rebound highs between them is called the neckline. When price breaks above that neckline, technical analysts treat the pattern as complete and the prior downtrend as over.
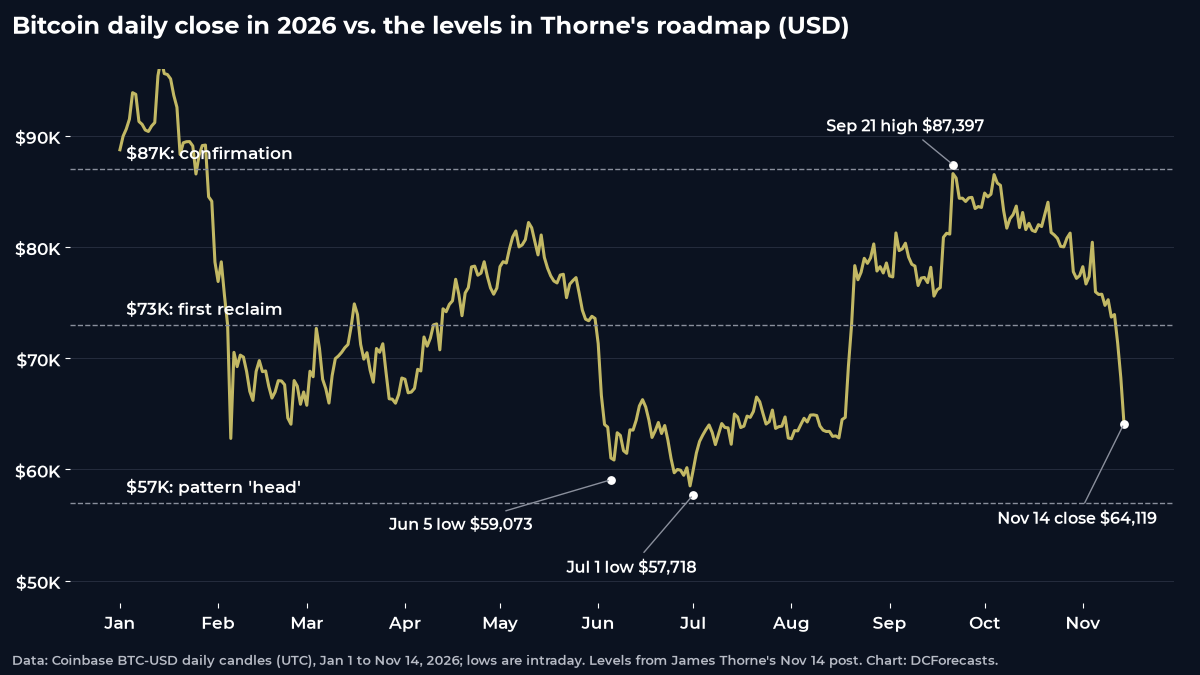
“The inverse head and shoulders is intact: left shoulder at $59k, head at $57k, right shoulder forming now,” Thorne wrote.
Coinbase price data supports his levels. Bitcoin fell to an intraday low of $59,073 on June 5, then dropped to $57,718 on July 1, its lowest point of 2026. From there it rallied to $87,397 on September 21, in line with the $87,000 level Thorne treats as confirmation. Bitcoin tested that zone again on October 2 with a high of $87,249 and was turned back both times. That double rejection is why a clean break above $87,000 carries so much weight in his roadmap.
Where bitcoin stands on the roadmap now
The recent selloff has pulled bitcoin back toward the area where Thorne expects the right shoulder to form. Bitcoin closed at $64,119 on Coinbase on November 14 and touched $61,946 on November 15. Even that low sits about 7% above the July bottom, so the pattern’s key low is still intact.
The first step on Thorne’s list is a move back above $73,000, about 14% above the November 14 close. Bitcoin traded above that level as recently as November 10, so it is not a distant target. The bigger test is $87,000, roughly 36% higher, which would take out the September peak and confirm the pattern.
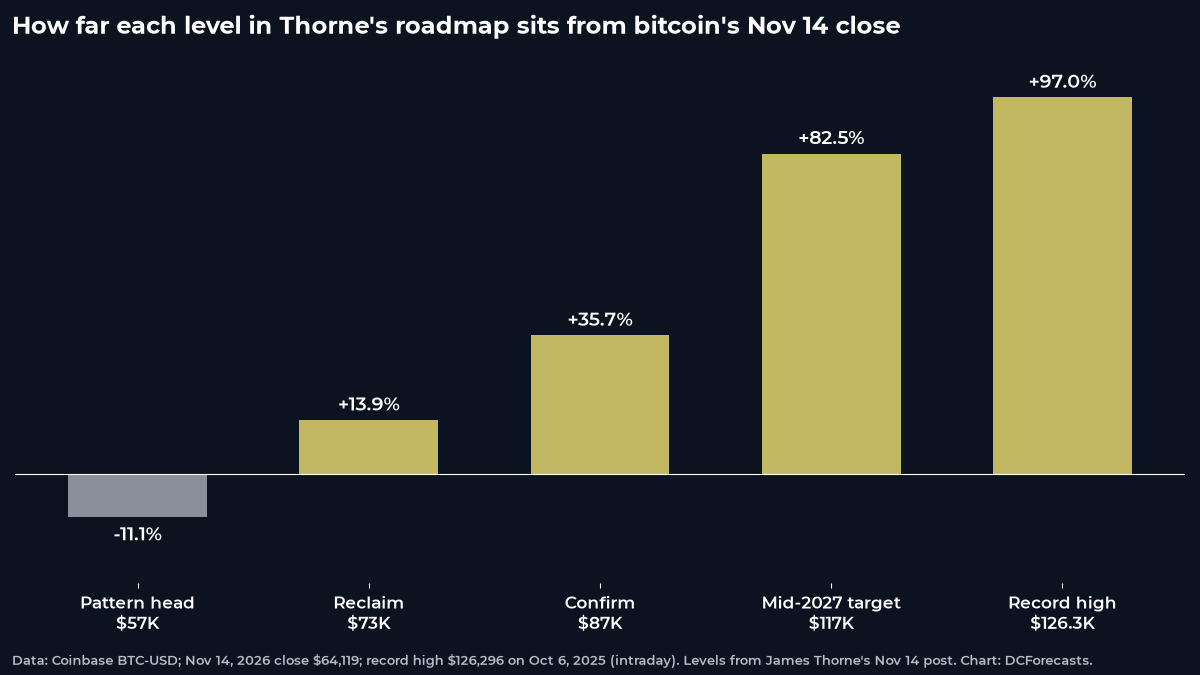
From there, Thorne’s $117,000 mid-2027 target would be an 82.5% gain from the November 14 close. A move past the $126,296 record set on October 6, 2025 would need bitcoin to nearly double.
Why the selloff may be setting up the next leg
Thorne’s view is a chart-based one, but other data points to a market that has already flushed out a lot of excess. Bitcoin’s 14-day RSI recently dropped toward 20, an oversold reading that DCForecasts found preceded a rebound within 90 days in four of five past cases. The only November that started worse than this one was in 2022, and that month marked the cycle low.

Liquidity is the part that still needs to turn. Stablecoin supply has fallen by about $16 billion in 30 days, the steepest drain since June 2022, though the pool is still more than twice its 2023 low. A pickup in stablecoin issuance would give buyers the firepower to push bitcoin through Thorne’s first two levels.
The shape of the year also matters. Bitcoin has already bounced hard once in 2026: from the July 1 low, it rallied about 51% to the September high in less than three months. A similar move from the current zone would put the $87,000 confirmation level back in play.
What would weaken the setup
Chart patterns are probabilities, not promises. The right shoulder only counts if bitcoin holds above the July low. A decisive break below the $57,000 head would undo the structure Thorne describes. Before that, the February 6 low of $60,001 is a nearer reference point, and buyers have already defended it once.
The timing is also uncertain. Thorne’s roadmap runs through mid-2027 for the $117,000 target, so even in his bullish case, the recovery is expected to take months rather than weeks.
A roadmap with clear checkpoints
What makes Thorne’s call useful is that each step can be measured. A daily close back above $73,000 would be the first sign that the right shoulder has formed. A push through $87,000 would confirm the reversal. Until then, the pattern remains a setup, not a signal.
For long-term holders, the message is familiar: bitcoin’s sharpest drawdowns have often set the stage for its strongest rallies. Thorne’s own opening question sums up the stakes: does a new all-time high come in 2027? If his checkpoints fall one by one, the chart says it could.
DC Forecasts is a leader in many crypto news categories, striving for the highest journalistic standards and abiding by a strict set of editorial policies. If you are interested to offer your expertise or contribute to our news website, feel free to contact us at [email protected]












Discussion about this post