



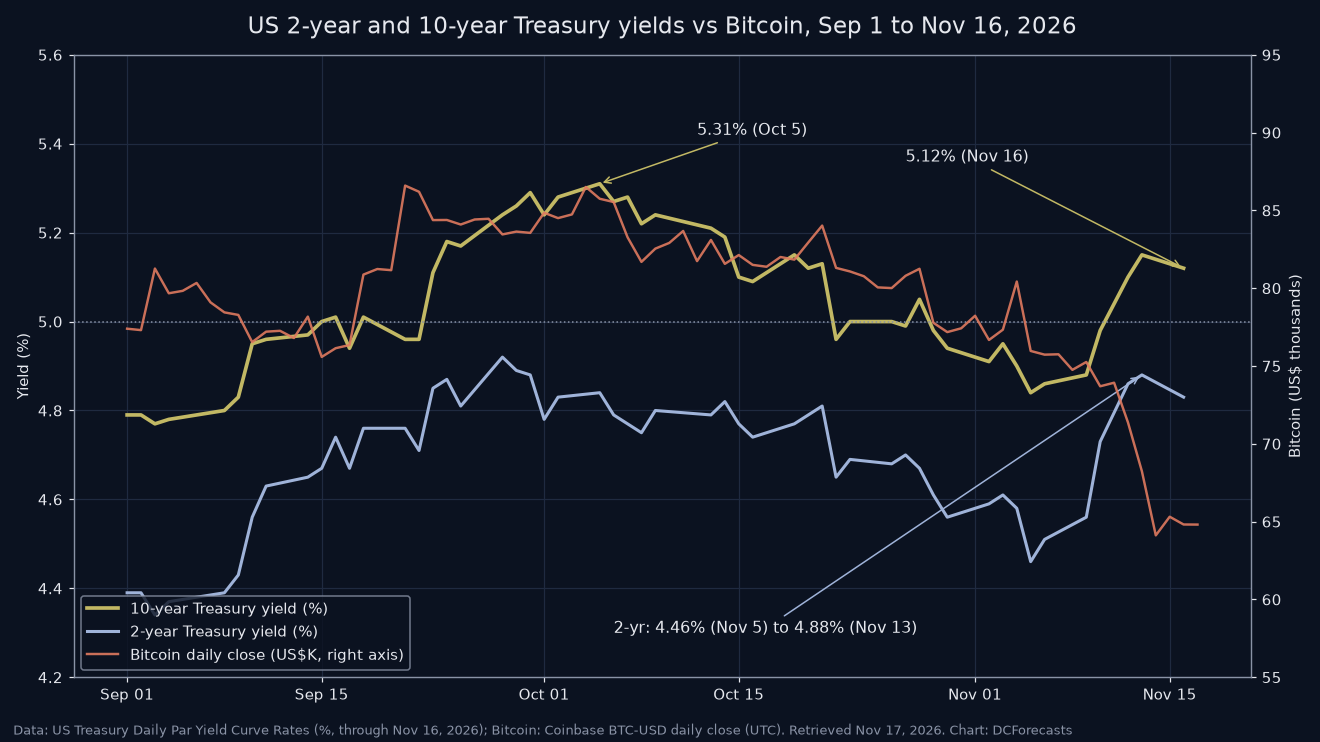
The 10 year Treasury yield is back above 5%. The US Treasury’s daily par yield curve put the benchmark at 5.12% on Nov. 16, after a 5.15% close on Nov. 13. That is 31 basis points above the 4.84% it hit on Nov. 5, the low point of a three-week pullback.
The move came over the same stretch in which Bitcoin fell from about $76,000 to under $65,000. But the bond market’s own record this autumn gives Bitcoin holders a reason to look past the short-term link. When the 10-year made its 2026 high in early October, Bitcoin was trading at its highest level of the period.
Two-year yields led the jump
The sharpest move came at the short end of the curve, which tracks expectations for Federal Reserve policy. The 2-year Treasury yield rose from 4.46% on Nov. 5 to 4.88% on Nov. 13. That is a 42 basis point jump in six trading sessions, and it outran the move in the 10-year. On Nov. 16 the 2-year eased slightly to 4.83%.
The biggest single step came on Nov. 10, the day of the delayed October inflation report, when the 2-year rose 17 basis points to 4.73%. As DCForecasts reported at the time, core prices rose 0.3% for the month and the release carried no annual inflation rate.
When short-term yields rise faster than long-term ones, the curve flattens. That is what happened here. The gap between the 10-year and 2-year yields narrowed to 0.24 percentage points on Nov. 12, down from 0.51 points on Oct. 7. On Nov. 16 it stood at 0.29 points. In plain terms, traders have been pushing back their expectations for rate cuts more than they have raised the premium for holding long-dated debt.
The highest 10-year yield since 2002
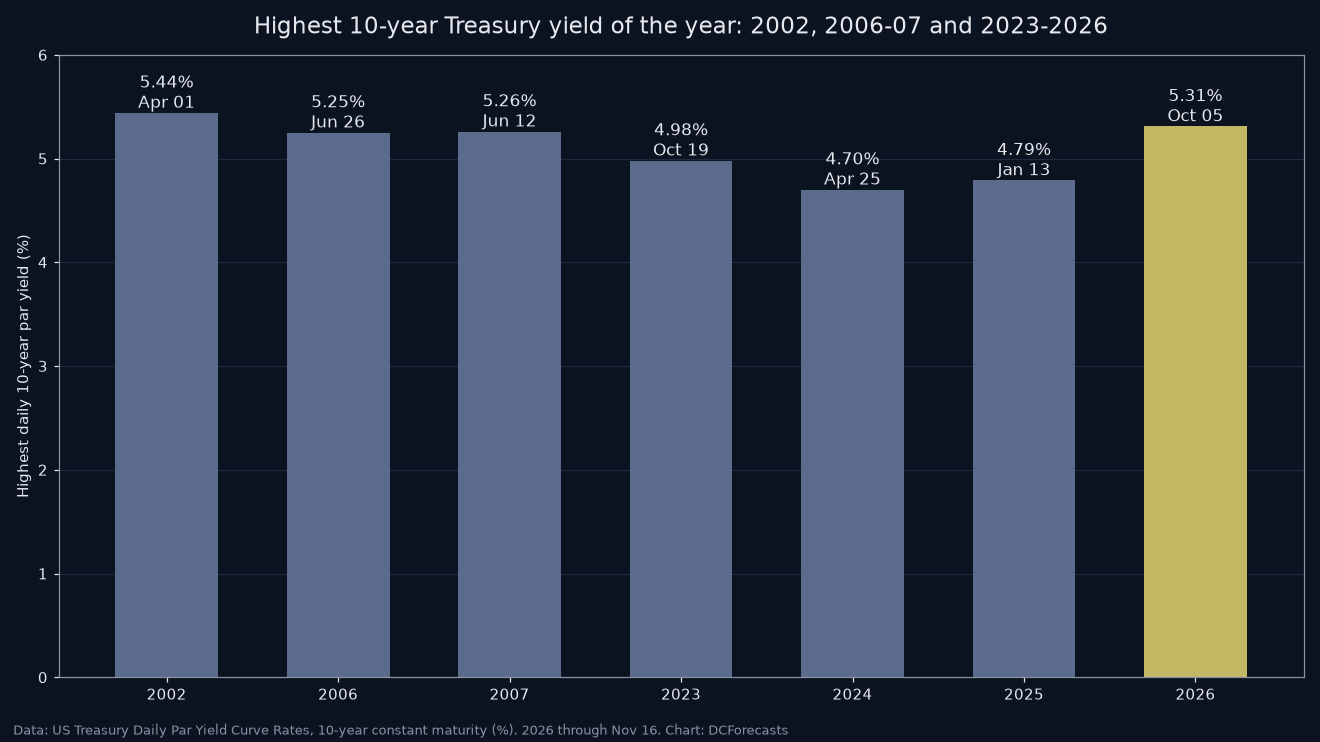
The current level is not new for 2026. The 10-year first closed at 5.00% on Sep. 15. Counting that day, 29 sessions have closed at or above 5%. It peaked at 5.31% on Oct. 5.
That peak matters for context. According to Treasury’s historical par yield data, the 10-year had not closed that high since May 14, 2002, when it finished at 5.32%. It sits above the peaks of the 2006–2007 cycle, which topped out at 5.26% on June 12, 2007. It is also well above the 4.98% high of October 2023, which was the post-2008 peak until this year.
The long bond has gone further. The 30-year Treasury yield reached 5.67% on Oct. 7, compared with 5.35% at its 2007 high and 5.11% in October 2023. It closed at 5.46% on Nov. 16.
For perspective, the 10-year started 2026 at 4.19% on Jan. 2. In just over ten months, the benchmark yield has climbed 93 basis points.

Bitcoin climbed into the October yield peak
The popular view is that higher yields are bad for Bitcoin, because cash and bonds pay more and risk appetite cools. The past two months show the relationship is not that simple.
On Sep. 15, the day the 10-year first closed at 5%, Bitcoin closed at $75,584 on Coinbase. On Oct. 5, when the 10-year hit its 5.31% high, Bitcoin closed at $85,749. That is a 13.4% gain while the benchmark yield climbed to a 24-year high.
The recent drop looks different. Bitcoin closed at $75,969 on Nov. 5 and at $64,817 on Nov. 16, a 14.7% decline as yields rebounded. Coinbase showed it near $64,800 on Nov. 17. But other forces were also at work. In its note on the slide, Grayscale pointed to stablecoin off-ramping, de-risking in AI stocks and the break below Bitcoin’s 200-day average. It also called the level an attractive entry point for long-term buyers.
Put together, this suggests the 2-year’s repricing of rate cuts weighed on risk appetite in November. The fact that the 10-year sits above 5% did not, by itself, cap Bitcoin’s price.
Why higher Treasury yields are a fiscal story too
Higher yields also have a cost for the US government, and that is part of Bitcoin’s long-term case.
Treasury’s Monthly Treasury Statement, published on the Fiscal Data site, shows gross interest on Treasury debt securities of $1.36 trillion in fiscal 2026, which ended Sep. 30. That compares with $1.216 trillion in fiscal 2025, an increase of about 11.9%.
The average rate Treasury pays has also turned higher. The average interest rate on total marketable debt rose to 3.570% at the end of October 2026, from 3.348% at the end of January. That figure lags market yields, because older, cheaper debt is only gradually refinanced at today’s rates. With the 10-year near 5.1%, each new long-term issue costs well above that 3.57% average.
Bitcoin’s supply schedule is fixed by code, and no interest bill can change it. That contrast helps explain why investors have kept treating Bitcoin as a long-term hedge even when it trades like a risk asset day to day. It ties in with the record US money supply DCForecasts covered in its M2 analysis.
What to watch next
The 2-year yield is the key gauge for crypto traders. It moved first in November, and a pullback from 4.88% would signal that rate-cut expectations are coming back. The 10-year’s 5.31% October high is the next marker for the long end. Treasury publishes the par yield curve every business day on its interest rate data page.
For Bitcoin, the autumn record suggests that a 10-year above 5% is something the market can live with. The bigger driver has been how quickly rate expectations shift. Past performance does not guarantee future results.
DC Forecasts is a leader in many crypto news categories, striving for the highest journalistic standards and abiding by a strict set of editorial policies. If you are interested to offer your expertise or contribute to our news website, feel free to contact us at [email protected]












Discussion about this post