



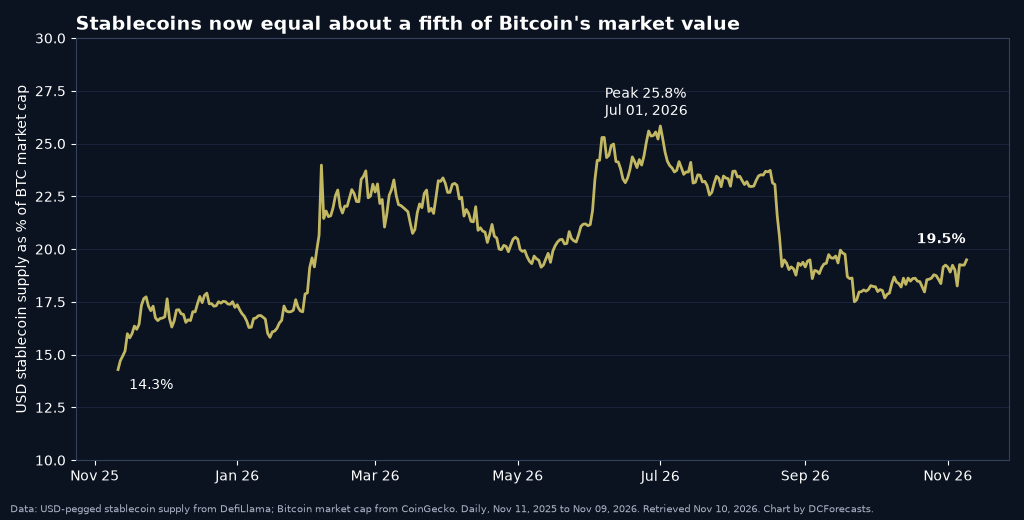
Bitcoin liquidity is often measured in ETF flows and order books, but one of the simplest gauges sits on stablecoin ledgers. Dollar-pegged stablecoins in circulation now equal about 19.5% of Bitcoin’s market value, up from 14.3% a year ago.
That is based on daily data for total USD stablecoin supply from DefiLlama and Bitcoin’s market capitalization from CoinGecko, which we compared over the 12 months to November 9, 2026.
The ratio matters because stablecoins are the cash that crypto traders hold on the sidelines. When that pile grows relative to Bitcoin, the market has more ready money that could rotate into BTC.
What the Stablecoin Supply Ratio Measures
Analysts usually express this relationship as the stablecoin supply ratio, Bitcoin’s market cap divided by stablecoin supply. A lower ratio means stablecoins carry more weight against Bitcoin. We flip it into a percentage here because it is easier to read.
On November 11, 2025, Bitcoin was worth about $2.11 trillion and USD stablecoins totalled $302.1 billion, a ratio of 7.0. On November 9, 2026, Bitcoin’s market cap stood near $1.50 trillion against $293.0 billion of stablecoins, a ratio of 5.13.
Why the Ratio Climbed
Honesty matters here. Most of the move came from Bitcoin’s price, not from new stablecoin money. CoinGecko’s daily close put BTC at about $105,950 on November 11, 2025 and about $74,740 on November 9, 2026, a decline of roughly 29%.
Stablecoin supply barely moved over the same period, slipping 3%. So the ratio rose because the denominator shrank while the cash pile held.
We believe that is still a constructive setup. A market where sidelined dollars have held near $300 billion while Bitcoin repriced lower is a market with fuel that has not left the building.
Spikes in the Ratio Have Lined Up With Price Lows
This year offers two clear examples. In early February, Bitcoin’s daily close fell from about $84,090 on January 31 to about $62,780 on February 6. Over that week, stablecoins jumped from 17.9% to 24.0% of Bitcoin’s market value.

The second came on July 1, 2026, when the reading peaked at 25.8%. Bitcoin closed near $58,570 that day while stablecoin supply sat at $303.4 billion.
What followed was constructive. By September 22, Bitcoin had climbed to about $86,600, and the ratio had fallen back to 17.5%, consistent with sidelined cash being put to work as prices recovered.
Two episodes are not a rule, and we would not treat the ratio as a timing tool. But they show how the measure behaves: it rises when Bitcoin is cheap relative to the cash waiting nearby. Today’s 19.5% sits in the middle of this year’s range.
The Stablecoin Market Cap Has Cooled
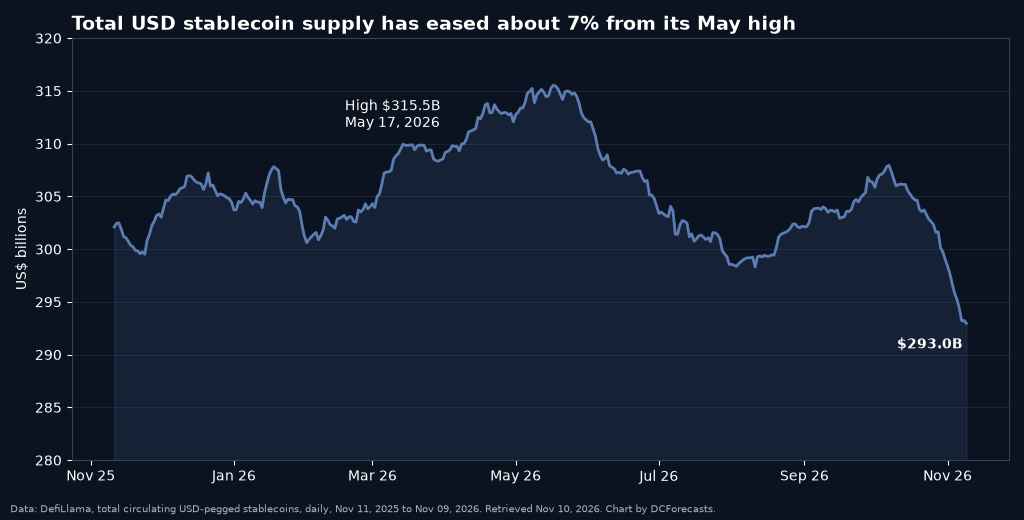
There is a caution flag too. Total USD stablecoin supply hit a high of $315.5 billion on May 17, 2026, according to DefiLlama, and has since eased about 7% to $293.0 billion.
The decline has accelerated in recent weeks. Supply stood near $307.9 billion on October 7 before dropping below $295 billion by November 7.
Tether’s USDT accounts for most of the market at about $176.2 billion, down from $184.0 billion a month earlier, DefiLlama data shows. Circle’s USDC is second at about $70.4 billion, compared with $73.0 billion a month ago.
Shrinking supply usually means some holders are redeeming stablecoins for bank dollars rather than parking them on exchanges. That is worth watching, because a ratio built on a falling cash pile is less powerful than one built on new inflows.
How This Fits Bitcoin’s Bigger Picture
Other signals point the same way. Bitcoin’s share of the total crypto market has pushed above 60%, which tells us money that stays in crypto is concentrating in BTC rather than spreading into smaller tokens.
Institutional channels have also held up. BlackRock’s spot fund reported a record 801,033 BTC at quarter-end, a reminder that a large share of new Bitcoin demand now arrives through ETFs rather than stablecoins on exchanges.
That is an important caveat for any stablecoin-based indicator. Stablecoins also fund payments, DeFi lending and trading in other assets, so not every dollar of supply is waiting to buy Bitcoin.
What We Are Watching Next
The first signal is whether stablecoin supply stabilizes around $290 billion or keeps contracting. A return to growth would turn a price-driven ratio into a genuine liquidity tailwind.
The second is the macro calendar. Bitcoin has been trading closely with equities, as our look at its rising correlation with the S&P 500 showed, so this week’s US inflation data could decide whether sidelined cash feels confident enough to move.
The third is the ratio itself. A move back above 22% without a fresh drop in Bitcoin’s price would mean stablecoin supply is growing again, the healthier version of this signal. A slide toward 15% would suggest that cash is being spent on BTC.
For now, the numbers show a market holding a sizable cash reserve relative to Bitcoin’s value. We believe that leaves room for a recovery to find buyers, though it guarantees nothing about timing or direction.
DC Forecasts is a leader in many crypto news categories, striving for the highest journalistic standards and abiding by a strict set of editorial policies. If you are interested to offer your expertise or contribute to our news website, feel free to contact us at [email protected]












Discussion about this post