



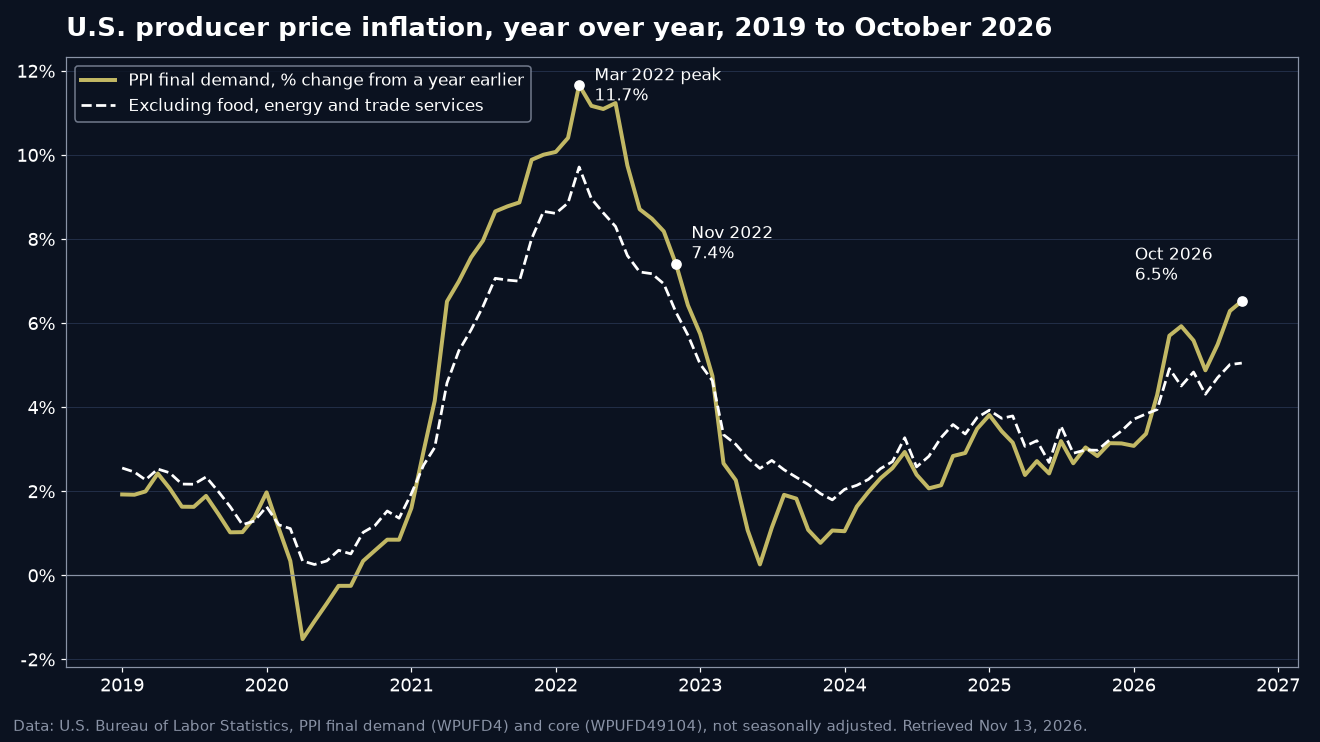
Wholesale inflation in the United States climbed to 6.5% in October, its fastest annual pace since November 2022, and Bitcoin slipped below $70,000 as traders priced in tighter Federal Reserve policy.
The Producer Price Index for final demand rose 6.5% from a year earlier, according to Bureau of Labor Statistics data. That is more than double the 3.1% rate recorded in January.
Bitcoin touched an intraday low of $67,555 on Coinbase on Friday, down from a close of $73,928 on Wednesday.
For Bitcoin investors, the useful comparison is not the headline number but the last time producer inflation ran this hot. In November 2022, the PPI was rising 7.4% a year and Bitcoin was carving out a cycle low near $16,000.
The bigger question now is whether this inflation scare is the start of a long squeeze or a shakeout inside a much larger market.
Wholesale Inflation Has Been Climbing All Year
The October reading did not come out of nowhere. The annual PPI rate was 3.4% in February, jumped to 5.7% by April and reached 6.3% in September before October’s 6.5%.
On a seasonally adjusted basis, final-demand prices rose about 0.3% in October from September.
The core measure, which strips out food, energy and trade services, rose 5.1% from a year earlier. That is its highest reading since December 2022, which suggests price pressure is spreading beyond volatile categories.
Producer prices matter because they often show up later in consumer prices. Businesses that pay more for inputs tend to pass at least part of that cost on.

Why the Fed Is Talking About More Hikes
The Fed’s target range for its benchmark rate currently stands at 3.75% to 4%, according to Federal Reserve data.
On Friday, Boston Fed President Susan Collins said in a Bloomberg TV interview that inflation “is too high and appears to be broadening,” and that some additional policy tightening looked warranted soon.
In prepared remarks at the Boston Fed’s annual economic conference the same day, she added that “over the longer run, stable prices create predictable economic conditions that are good for housing.”
As we noted when rate hike bets jumped earlier this week, higher policy rates raise the return on cash and tend to cool demand for risk assets in the short run. Bitcoin has not been immune to that.
How Bitcoin Is Absorbing the Pressure
The pullback has been steady rather than chaotic. Bitcoin closed at $71,370 on Thursday, about 12% below the $81,131 intraday high it set on Nov. 4.
U.S. spot Bitcoin ETFs have seen outflows on every trading day since Oct. 30 except Nov. 4, according to Farside Investors data. Net outflows were $299.8 million on Nov. 11 and $284.1 million on Nov. 12.
That is real selling, and it deserves to be stated plainly. But the scale needs context. Cumulative net inflows into the U.S. funds still stand at about $54.9 billion, so the recent exits are a small fraction of the money that has come in since launch.
There are also buyers in the mix. The MSBT fund, which carries the lowest fee in the group at 0.14%, recorded net inflows on each trading day from Nov. 9 to Nov. 12, even as the group as a whole saw money leave. We covered the broader shift in November’s ETF flow picture earlier this week.
What 2022 Can and Cannot Teach Us
The last inflation wave is the obvious reference point. Producer inflation peaked at 11.7% in March 2022, when Bitcoin closed the month at $45,528.
Prices then fell for most of that year as the Fed raised rates aggressively. Bitcoin’s lowest daily close came on Nov. 21, 2022, at $15,760, in the same month the PPI rate was still running at 7.4%.
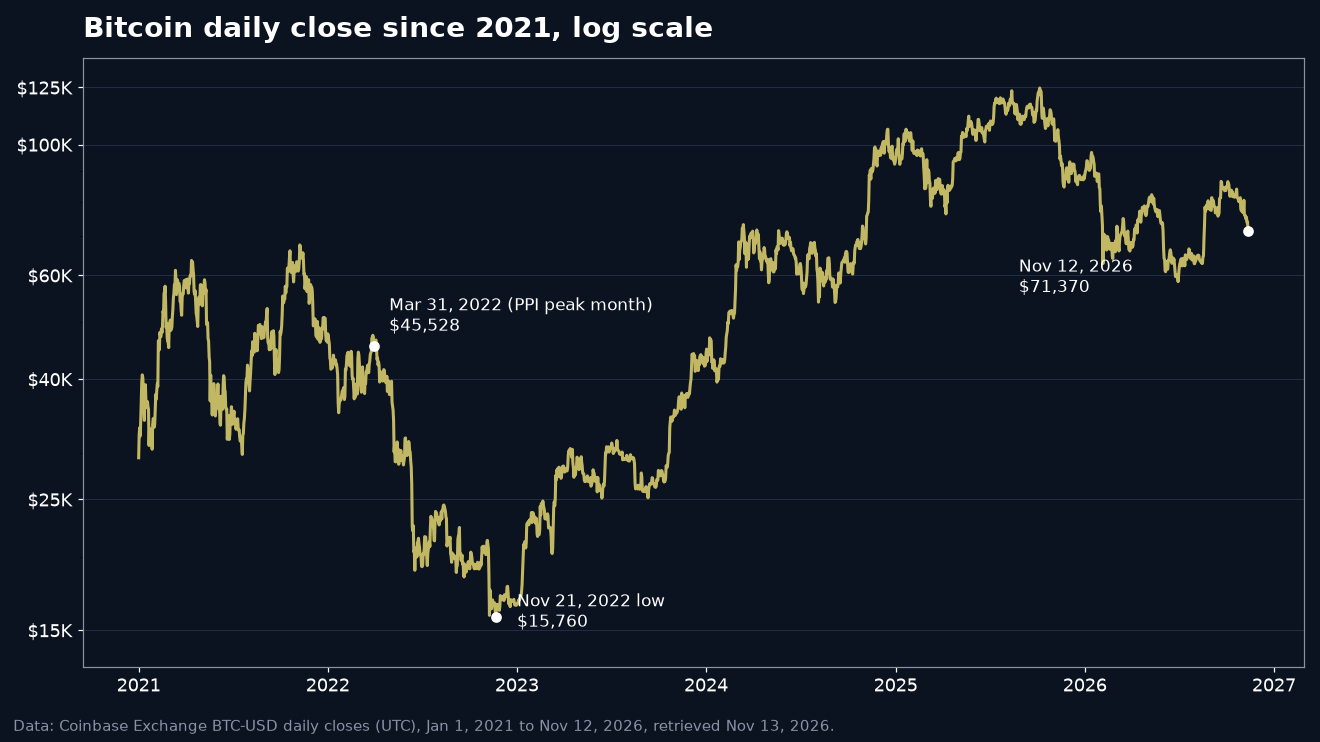
From that low to Thursday’s close, Bitcoin has gained roughly 4.5 times its value. Investors who bought during the peak of the last inflation scare were rewarded once price pressure began to cool.
The differences matter too. Today the Fed’s range is 3.75% to 4%, and Bitcoin trades at more than four times its 2022 low with a deep ETF market behind it. History offers a template, not a guarantee.
The long-term trend also looks sturdier than the headlines suggest. As we showed in our look at the 200 week moving average, that slow-moving line sat near $67,754 last week, close to where Friday’s dip found buyers.
Can Bitcoin Reclaim $70,000 as Inflation Data Cools?
The first level to watch is $70,000. A move back above it from about $68,600 at the time of writing would need a gain of roughly 2%.
The second is ETF flows. A return to net inflows would signal that the selling from U.S. funds has run its course.
The third is the Fed’s Dec. 8 to 9 meeting and the inflation data that lands before it. If producer prices start to cool, the hike narrative could fade faster than markets expect.
We believe the current setup looks more like an inflation-driven reset than a break in Bitcoin’s long-term story. Supply is still capped at 21 million coins, and regulated access through ETFs and banks keeps widening.
The coming weeks will show whether wholesale inflation has peaked. If it has, Bitcoin may soon be trading on adoption again rather than on rate fears.
DC Forecasts is a leader in many crypto news categories, striving for the highest journalistic standards and abiding by a strict set of editorial policies. If you are interested to offer your expertise or contribute to our news website, feel free to contact us at [email protected]











Discussion about this post