



Bitcoin transactions ran at a record pace in October 2026. The network confirmed an average of 710,134 transactions a day across the month, according to Blockchain.com’s daily data. That is the highest monthly average in the chart history we reviewed and the ninth monthly increase in a row.
November has started more quietly. Over its first 14 days, the average fell to 507,599 a day, about 29% below October, as the price slide cooled trading and transfers.
Even after that pullback, usage is still running about 20% above November 2025. We think that context matters more than the month-to-month dip.
Nine straight months of rising Bitcoin transactions
The climb began after a slow January. Daily confirmed transactions averaged 390,877 that month, the weakest reading of 2026.
From there, the monthly average rose every single month: 468,602 in February, 560,212 in April, 645,363 in May and 695,974 in September. October’s 710,134 capped the run.
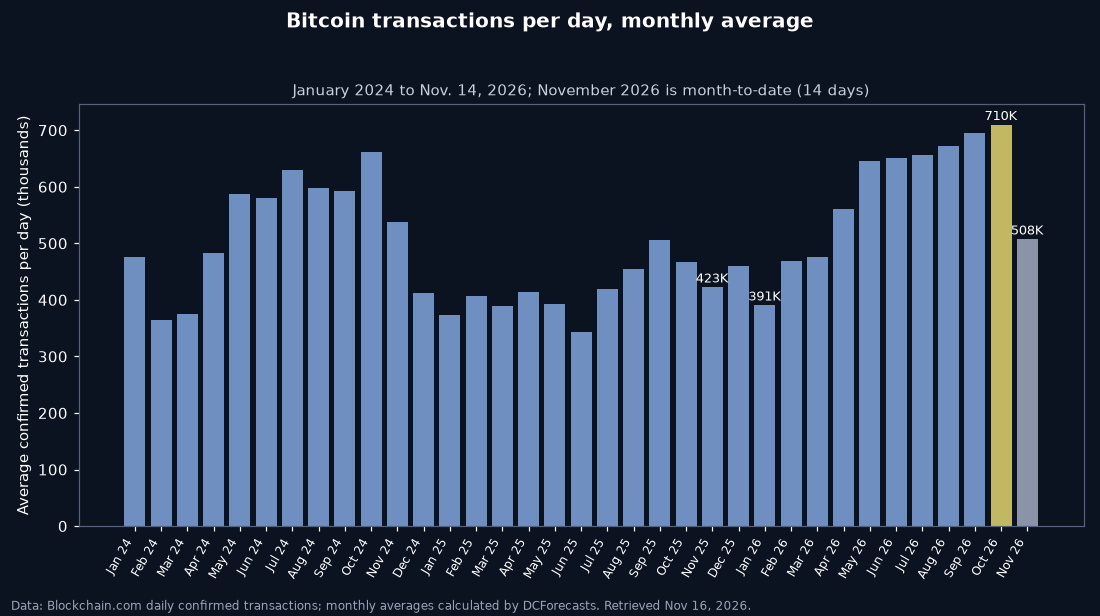
For comparison, the previous high month in this window was October 2024, at 660,682 a day.
October 2026 beat that mark by about 7%. It was also about 52% above October 2025, when the network averaged 467,643 a day.
In total, Blockchain.com counted just over 22 million confirmed Bitcoin transactions in October alone.
Is the surge just a few big wallets?
A fair question about any activity spike is whether a handful of very busy addresses is inflating it. Blockchain.com publishes a second series that removes transactions involving the network’s 100 most popular addresses.

That series barely changes the picture. It shows an October average of 709,960 a day, almost identical to the headline figure. On this measure, the growth was broad rather than concentrated in a few large hubs.
Not every gauge is as strong. Unique addresses used each day averaged about 474,000 over the 30 days to Nov. 14, roughly 8% lower than a year earlier.
The estimated dollar value moved on-chain also averaged about $8.35 billion a day over the same window, down from about $12.07 billion a year ago. Part of that drop reflects lower Bitcoin prices, since the same coins are now worth fewer dollars.
What November’s slowdown in Bitcoin transactions shows
The pullback is visible in the daily data. The seven-day average held mostly between 600,000 and 770,000 from August through October before sliding to about 480,000 by Nov. 14.
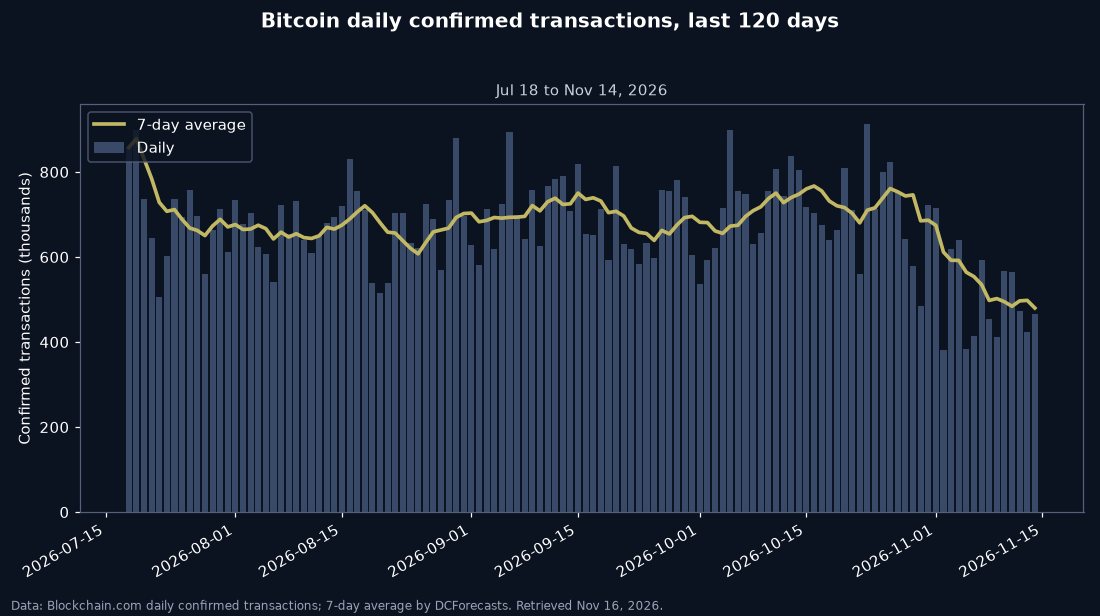
That cooling lines up with a rough stretch for the market. Bitcoin’s Sunday dip reached $61,946, the lowest level since July, before buyers stepped back in.
Blockchain.com’s data does not explain why individual users transact less, so we cannot pin the slowdown on a single cause. Lower prices, quieter speculation and fewer batch payments could all play a part.
What the data does show is that a slower November still sits well above the lows of 2025 and early 2026. The base of activity has moved higher.
Cheap blocks are part of the story
High activity has not made Bitcoin expensive to use. Our recent look at fees found a fast transfer cost about 18 cents even during the sell-off.
Earlier this month, we also found that blocks were 98% full while fees barely topped 1 satoshi per vByte. Full blocks and low fees together point to steady demand for block space without a bidding war.
For everyday users, that is the best of both worlds. The network is busy, but sending coins remains affordable.
Our view on the on-chain analysis
We see October’s record as a sign that people kept using Bitcoin through a falling market. Usage built steadily for nine months rather than spiking for a single week.
Price and activity do not always move together, and this year shows why both deserve attention. While the price fell, the number of payments settled on the base layer kept rising.
Investors should still read the data with care. A transaction count is not a count of people, and one user can create many transactions. The lower address and dollar-volume figures are a reminder that not every on-chain gauge is at a high.
Fundamentals such as the realized price also suggest the average coin is still held at a profit, even after the recent slide.
What to watch next
Three signals will tell us whether November’s dip is a pause or a turn. First, whether the seven-day average of Bitcoin transactions climbs back above 600,000. Second, whether daily active addresses recover toward last year’s levels. Third, whether fees stay low as activity rebuilds.
If usage recovers while fees stay cheap, it would support the case that Bitcoin’s network is growing into a bigger base of everyday demand. For now, October 2026 stands as the busiest month in the records we reviewed, and that is a strong foundation heading into the end of the year.
DC Forecasts is a leader in many crypto news categories, striving for the highest journalistic standards and abiding by a strict set of editorial policies. If you are interested to offer your expertise or contribute to our news website, feel free to contact us at [email protected]












Discussion about this post