



Bitcoin exchange balances barely moved while the price fell 20.1% in ten days, and we think that quiet line on the chart deserves more attention than the red candles above it.
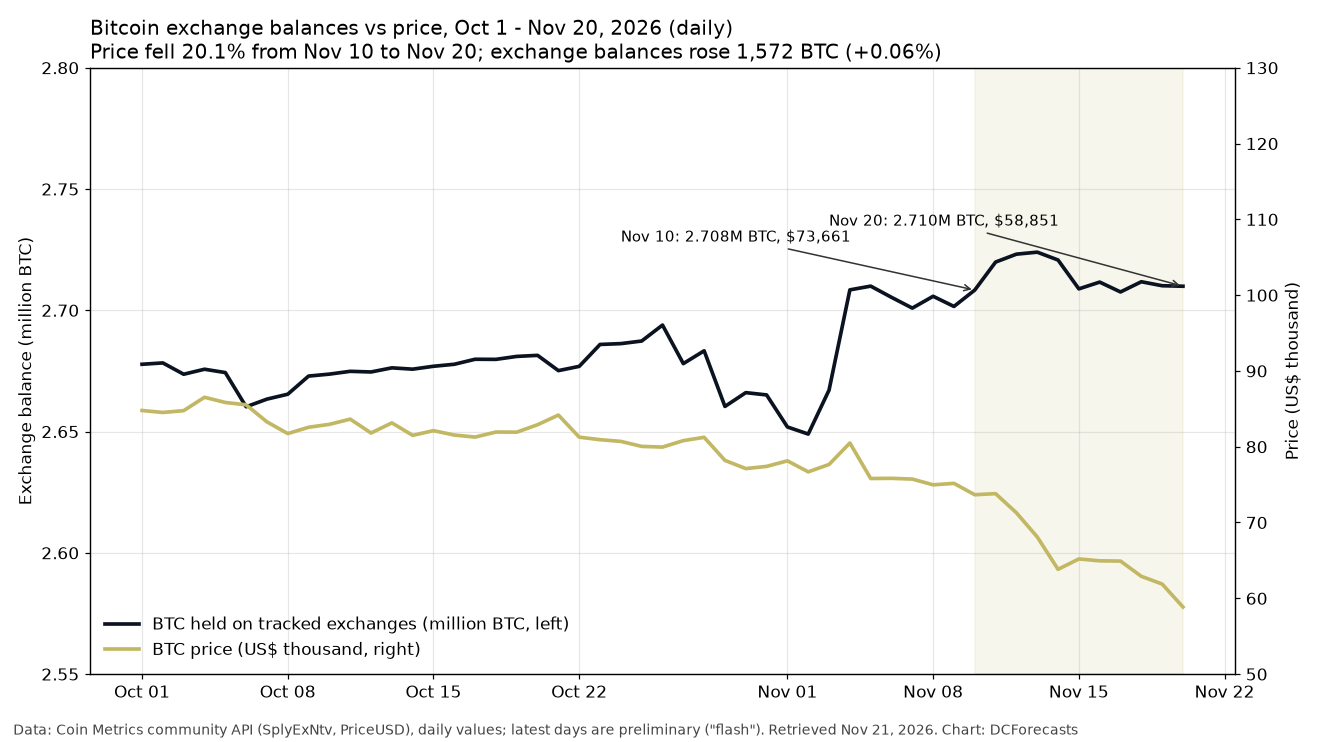
According to Coin Metrics data, wallets attributed to the exchanges it tracks held 2,708,334 BTC on November 10, when Bitcoin closed at $73,661.
By November 20, with Bitcoin at $58,851, those balances stood at 2,709,906 BTC. That is a gain of just 1,572 BTC, or 0.06%.
For Bitcoin investors, that matters because a real capitulation usually shows up as coins rushing onto trading platforms to be sold.
The bigger question now is whether this selloff is being driven by leverage and sentiment rather than by long-term holders heading for the exit.
What Do Bitcoin Exchange Balances Show This Month?
The month did not start quietly. Tracked balances jumped by about 59,450 BTC on November 3 and 4 alone, and that is where most of the increase since October 1 came from.
After that, the line went flat. Balances peaked at 2,723,962 BTC on November 13 and have since slipped by 14,055 BTC, even as the price dropped another 13.6%.
Friday, November 20, was the busiest test. Deposits reached 41,305 BTC, the heaviest single day of inflows since August 21.
Withdrawals of 41,821 BTC more than matched them, and the day’s net balance change was a decline of 212 BTC.

We would be careful not to overstate any single day. Coin Metrics marks its latest readings as preliminary, and the metric only covers wallets it attributes to the exchanges it tracks.
Even so, the direction over ten days is clear, and it does not look like a wave of forced selling from spot holders.
How Does This Selloff Compare With Past Crashes?
To put the numbers in context, we measured exchange balances over four earlier sharp declines using the same Coin Metrics series.
- March 5-12, 2020: price down 45.3%, balances up 51,329 BTC (+1.69%).
- May 10-19, 2021: price down 32.7%, balances up 112,365 BTC (+3.79%).
- June 5-18, 2022: price down 36.4%, balances up 7,423 BTC (+0.24%).
- July 29 to August 5, 2024: price down 18.7%, balances up 2,120 BTC (+0.07%).
The current window, a 20.1% decline with a 0.06% rise in balances, sits at the calm end of that list.
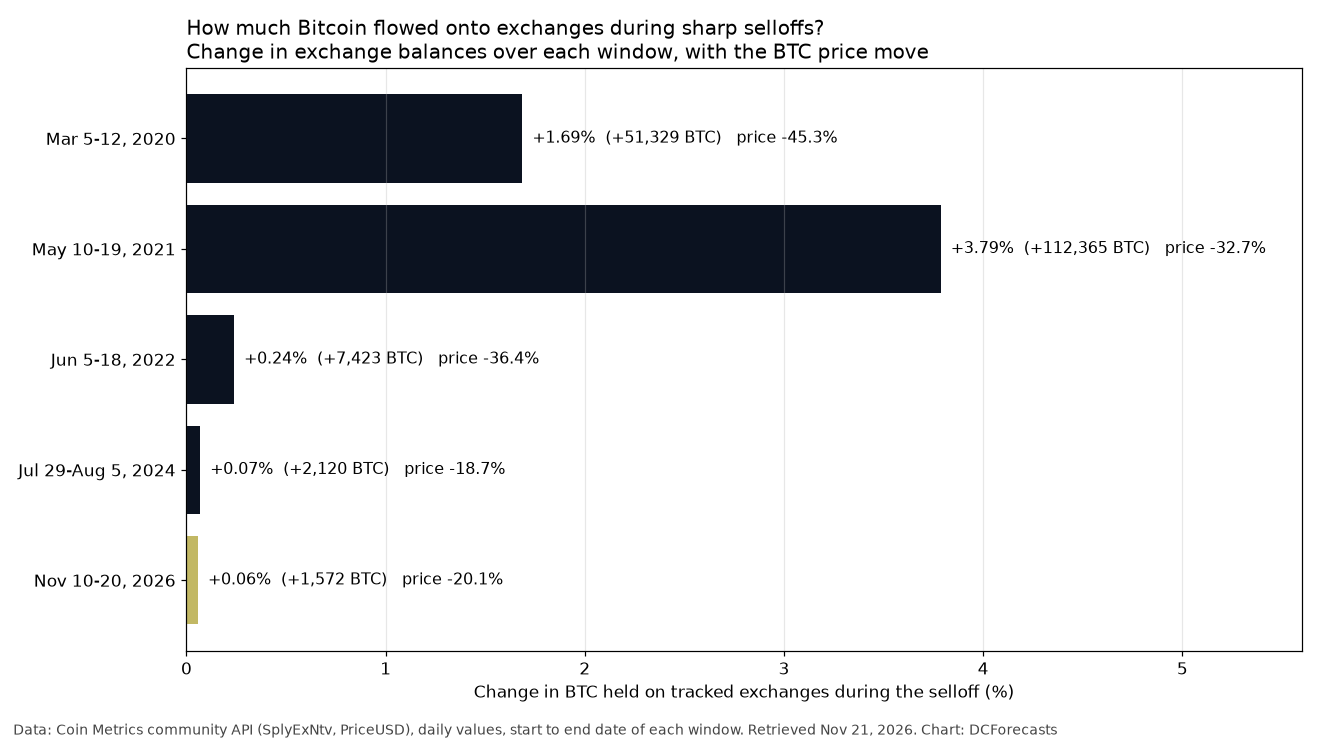
The 2021 episode is the useful contrast. Back then, more than 112,000 BTC landed on exchanges in nine days as holders scrambled to sell.
This time, sellers appear to be working with coins already sitting on platforms, rather than pulling fresh supply out of cold storage.
Fewer Coins on Exchanges Than at the Peak
The longer view is even more striking. On October 6, 2025, when Bitcoin set its record daily close of $124,824 in the Coin Metrics series, exchanges held 2,731,090 BTC.
Today they hold roughly 21,184 BTC less, even though the price has fallen 52.9% from that close.
As a share of the 20.11 million BTC in circulation, exchange holdings now sit at 13.47%. That compares with 14.85% at the start of 2025 and 17.17% in mid-March 2020.
Balances are also about 465,600 BTC below their all-time high of 3,175,542 BTC, set on July 27, 2021.
To be fair to the data, balances are not at a cycle low. They bottomed at 2,561,263 BTC on April 25, 2026, and are about 148,600 BTC above that level.
Still, a market that has lost half its value without a matching flood of coins onto exchanges looks very different from the panics of past cycles.
Why We Believe Holders Are Sitting Tight
We believe the flat balance line tells us the pressure is coming mostly from traders, not from the investors who own the bulk of the supply.
That fits what we saw when Bitcoin’s daily close slipped under $62,000 on November 19, at a time when stocks and gold were also under pressure.
It also fits the cost-basis picture. Our look at Bitcoin’s realized price near $53,762 showed the market as a whole still sitting on unrealized profit, with an MVRV ratio of 1.27 on November 13.
Coin Metrics put that ratio at 1.10 on November 20, so the cushion has narrowed, but it has not disappeared.
When coins stay in self-custody through a 20% drop, the supply available to sell on platforms does not grow. Over time, that can make a market easier to lift once demand returns.
None of this guarantees a bottom. Prices can keep falling even when holders stay put, especially if leveraged positions keep unwinding.
What Should Bitcoin Investors Watch Next?
Bitcoin traded near $58,220 early on Saturday, down 6.2% over 24 hours, according to CoinGecko data.
From here, we would focus on a few signals in the days ahead.
- Exchange balances: a sustained climb back above 2.72 million BTC would suggest holders are finally moving to sell.
- Daily inflows: another day above 40,000 BTC that is not matched by withdrawals would be a warning sign.
- The share of supply on exchanges: a steady drift below 13.4% would extend the long downtrend.
- Spot ETF flows, which turned sharply negative in November, and the broader mood in stocks.
We believe the most constructive reading is also the simplest one: Bitcoin’s holders have watched a 20% drop in ten days and mostly kept their coins where they were.
With a fixed 21 million supply and a shrinking slice of it on exchanges, the coming weeks will show whether that patience becomes the base for the next recovery.
DC Forecasts is a leader in many crypto news categories, striving for the highest journalistic standards and abiding by a strict set of editorial policies. If you are interested to offer your expertise or contribute to our news website, feel free to contact us at [email protected]












Discussion about this post