



November has a reputation as one of Bitcoin’s friendlier months. The record since 2016 is far more balanced than that, and the Bitcoin 4 year cycle explains the pattern much better than the calendar does.
We pulled every daily close for BTC-USD on Coinbase Exchange back to 2015 and measured each month from one month-end close to the next.
Across the ten Novembers from 2016 to 2025, Bitcoin rose five times and fell five times. The median result was a 0.3% loss, even though the average was a 5.4% gain thanks to a few explosive years.
November 2026 has started on the soft side. Bitcoin closed October at $77,424 and finished Sunday, November 8 at $74,754, down 3.4% for the month so far.
So is this a warning sign, or just a familiar stretch of the cycle?
What Do Bitcoin Monthly Returns Actually Show?
Looking at all twelve months, the strongest calendar months over the past decade have been October, July, February and April, each with a median gain above 11%.
October stands out most, finishing higher in eight of the last ten years with a median return of 12.7%. That is where the “Uptober” nickname comes from.
November sits right in the middle of the pack. Its median of -0.3% places it close to flat, alongside January and June, rather than among the standout months.
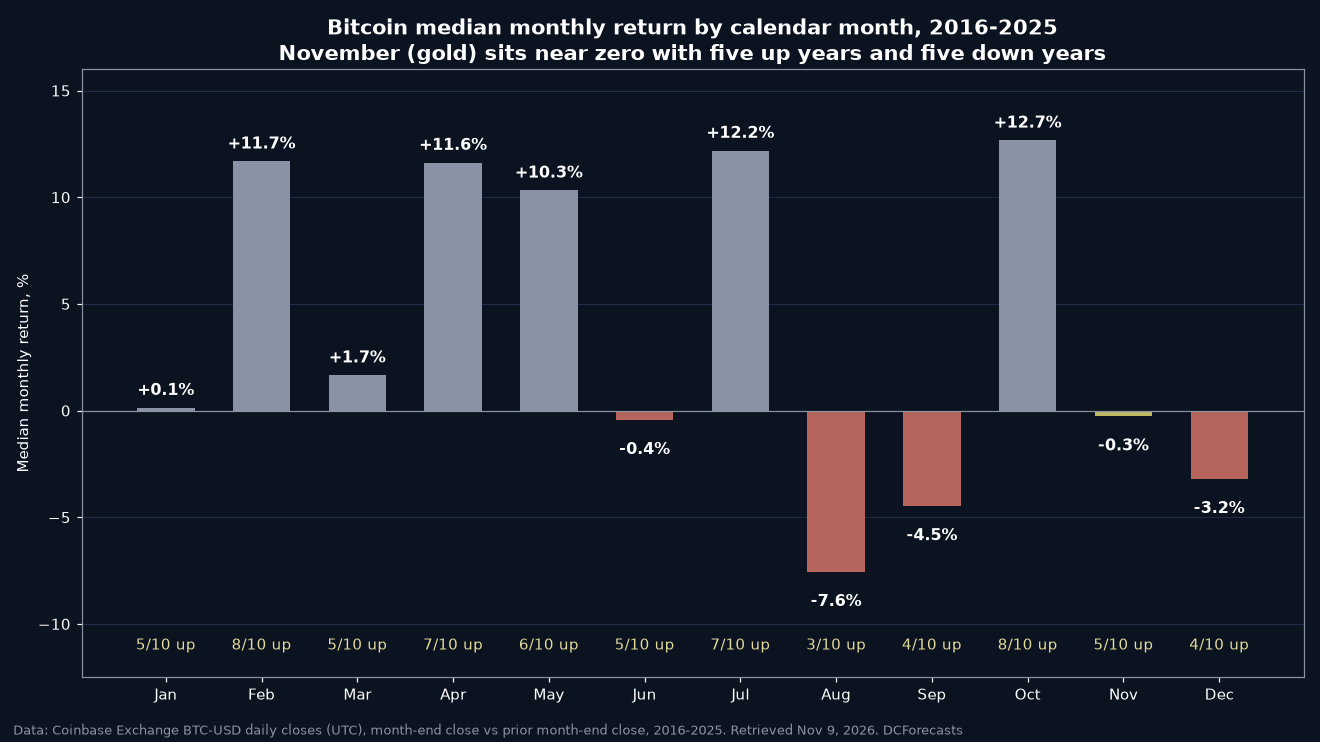
The takeaway is simple. A calendar month on its own has not been a reliable guide to Bitcoin’s next move.

Why the Bitcoin 4 Year Cycle Matters More Than the Month
Bitcoin’s supply schedule is the better lens. Roughly every four years, the block subsidy paid to miners is cut in half, slowing new issuance. The last three halvings came in July 2016, May 2020 and April 2024.
The April 2024 event cut the reward from 6.25 BTC to 3.125 BTC per block. Each time, the same amount of demand has to absorb half as many new coins, and the Bitcoin halving cycle has tended to shape the market’s rhythm in the months and years that follow.
That rhythm, rather than the name of the month, is what has historically separated strong Novembers from weak ones.
When the November results are sorted by where each year fell in that cycle, a clearer picture emerges.
- Halving years: 2016 (+6.6%), 2020 (+42.8%) and 2024 (+37.4%). All three Novembers closed higher.
- The year after: 2017 (+53.7%), 2021 (-7.1%) and 2025 (-17.5%). Mixed, with late-cycle peaks in play.
- Two years after: 2018 (-36.9%) and 2022 (-16.2%). Both were weak.
- The year before: 2019 (-17.5%) and 2023 (+8.9%). Split.
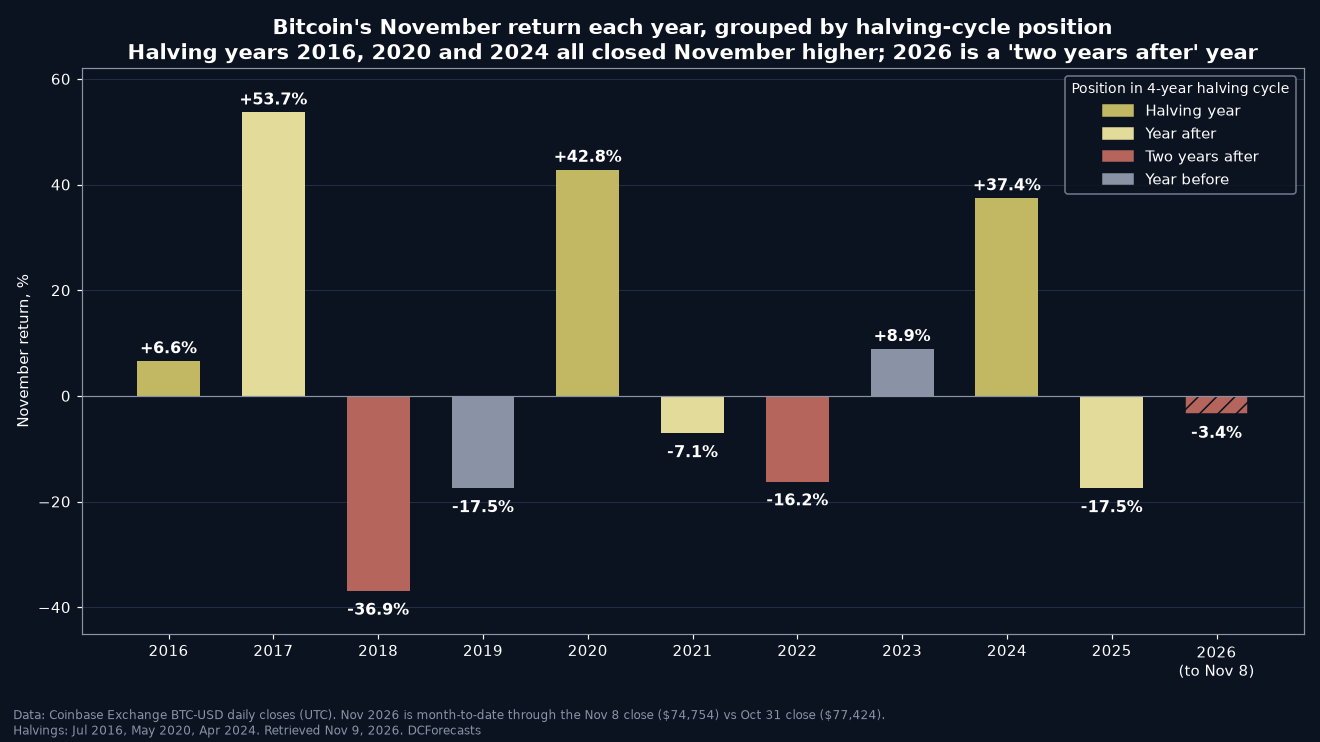
Ten data points are a small sample, so we treat this as context, not a rule. Still, it is far more informative than the monthly average alone.
Where Does November 2026 Fit in the Bitcoin Cycle?
2026 is the second year after the April 2024 halving. That puts it in the same slot as 2018 and 2022, the two weakest Novembers on the chart.
It would be dishonest to ignore that. The data show this part of the cycle has historically been the hardest stretch for Bitcoin, and 2026 has followed a choppy path, including a 20.5% drop in June and a 7.3% slide in October.
But the same years also tell the more important part of the story. Those difficult phases were where the cycle reset.
In 2018, Bitcoin’s lowest close of the year came on December 15 at $3,183. Twelve months later it closed at $7,111, up 123%.
In 2022, the low close arrived on November 21 at $15,760. A year later Bitcoin was at $35,752, a gain of 127%.
We believe that is the real lesson of the cycle. The weak stretch two years after a halving has historically been where patient buyers did their best accumulating, not where the bull story ended.
Our earlier look at whether the Bitcoin cycle low is already in covers how cycle analysts are framing this phase.
How Is This Cycle Different?
There are good reasons to think this cycle may not repeat 2018 or 2022 in full.
Bitcoin’s swings have become much smaller as the market has matured, as our analysis of how Bitcoin volatility has nearly halved since 2021 showed. A 3.4% monthly dip today looks very different from the 36.9% November collapse of 2018.
Spot ETFs, corporate treasuries and deeper derivatives markets also give Bitcoin a broader base of long-term holders than it had in earlier cycles.
None of that guarantees a rally. It does suggest the drawdowns of this phase may be shallower than the history books.
What Should Bitcoin Investors Watch Next?
With three weeks of November left, the month-to-date figure can still change a lot. A 3.4% gap is small next to the double-digit November moves seen in seven of the last ten years.
We would watch the November 30 close against the October close of $77,424 as the simple scorecard for the month.
For the bigger picture, history argues for patience. In 2018 and 2022, buyers who held through the weak late-year months were up more than 90% twelve months after the November close.
Past cycles do not promise future returns. But they make a strong case that this stage of the cycle has rewarded conviction far more than it has punished it.
DC Forecasts is a leader in many crypto news categories, striving for the highest journalistic standards and abiding by a strict set of editorial policies. If you are interested to offer your expertise or contribute to our news website, feel free to contact us at [email protected]












Discussion about this post