



The bitcoin Mayer Multiple fell to 0.90 at Sunday’s close, its lowest reading since early August. Bitcoin ended November 15 at $65,315 on Coinbase, about 10% below its 200-day moving average of $72,921.
That puts the gauge in territory it has occupied on only about a quarter of trading days since 2016. It also follows a cycle in which Bitcoin never came close to the overheated readings that marked earlier tops.
We believe that second detail matters as much as the first. Below, we walk through what the indicator measures, where it sits in its own history, and what past readings near this level did and did not deliver.
What the Bitcoin Mayer Multiple Measures
The Mayer Multiple was popularized by investor Trace Mayer. It divides Bitcoin’s price by its 200-day simple moving average.
A reading of 1.0 means price sits exactly on the long-term trend line. Readings above 2.4 have traditionally been treated as overheated, while readings below 1.0 show price trading under its 200-day average.
For this analysis, we used Coinbase BTC-USD daily closing prices in UTC, starting in July 2015. The first full 200-day reading lands on February 4, 2016, which gives us more than 3,900 daily observations through November 15, 2026.
The Break Below the 200-Day Moving Average
On November 10, we flagged that the cushion above the bitcoin 200 day moving average had shrunk to about 2%. Two days later the line gave way.
Bitcoin closed at $71,370 on November 12, taking the multiple to 0.98. Closes of $68,237 and $64,119 followed, and the multiple bottomed at 0.88 on November 14 before Sunday’s small bounce lifted it to 0.90.
That ended a run that began on August 19, when the multiple reclaimed 1.0 after spending more than nine months below it. The streak above the line lasted 85 days.

The average itself is now flattening. It peaked near $73,190 on November 5 and has eased only slightly since, so the trend line has not yet turned sharply lower.
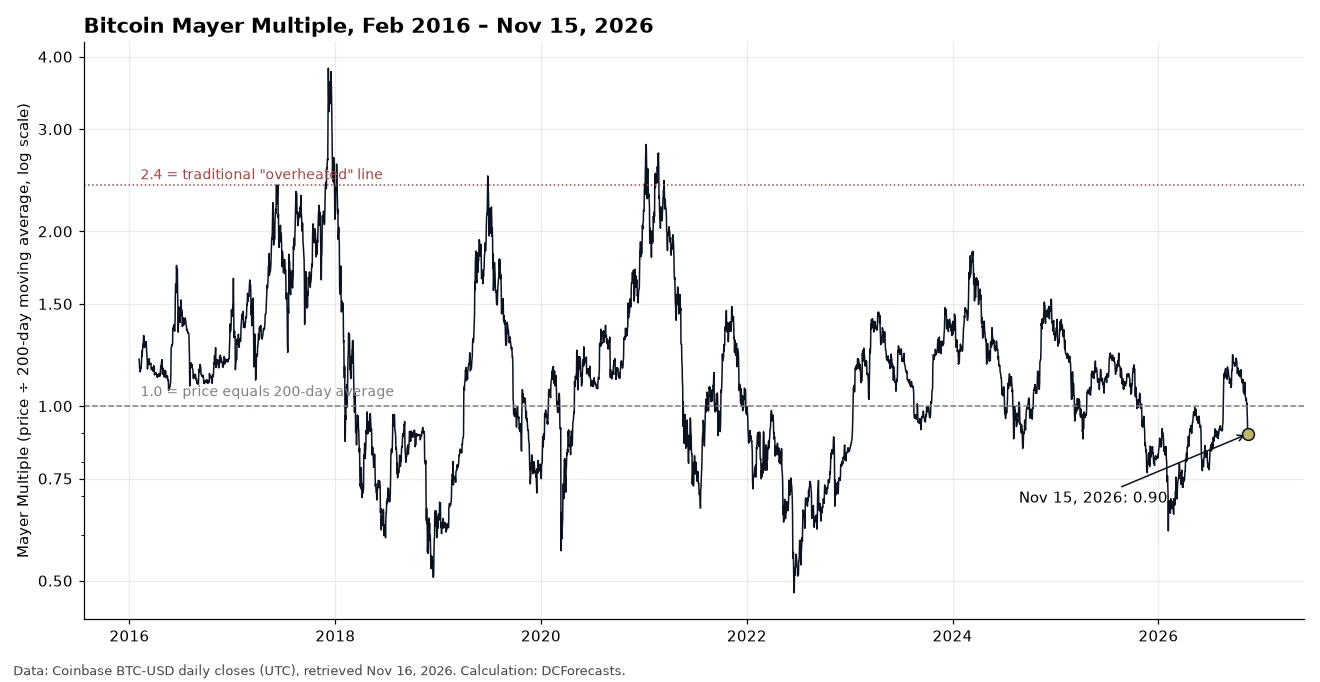
Where 0.90 Sits in Bitcoin’s History
Since February 2016, the multiple has closed below today’s 0.90 on about 27% of days. It has spent roughly 38% of all days below 1.0.
In other words, readings under the trend line are common in Bitcoin’s history, but readings this far under it are less so. Deeper troughs have still come before.
The lowest yearly readings in our data were 0.51 in December 2018, 0.56 during the March 2020 crash, and 0.48 in June 2022. Earlier this year, the multiple dropped to 0.61 on February 5, when Bitcoin closed at $62,791.
So the current level is a discount to trend, not an extreme one. Bitcoin would need to fall well below $60,000 at today’s average to revisit the lows of past bear phases.
This Cycle Never Overheated
The more striking story is on the other side of the chart. In 2017 the multiple peaked at 3.82, and in 2021 it reached 2.82, both well above the traditional 2.4 warning line.
This cycle stayed far calmer. The highest daily reading was 1.85 in March 2024, and the 2025 peak was just 1.41 in January.
When Bitcoin set its record close of $124,720 on October 6, 2025, the multiple stood at only 1.18. In 2026 the high was 1.23, recorded on September 21.
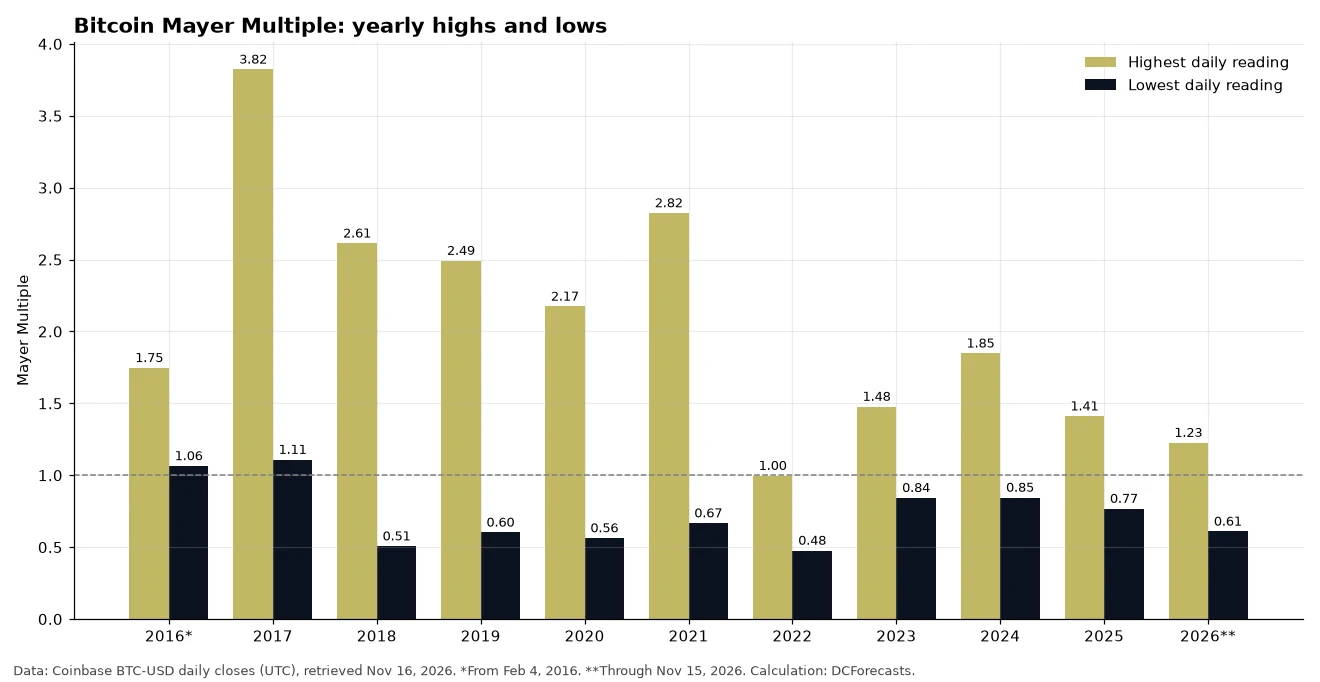
We read this as a market with far less speculative excess than in prior cycles. Rallies built on ETF demand and corporate treasuries have been steadier, with smaller blow-off phases.
That fits other gauges we track. Our recent look at Bitcoin’s realized price near $53,762 showed the average coin still in profit despite the sell-off.
What Past Readings Near 0.90 Delivered
History offers a mixed but useful guide. We looked at every day since 2016 when the multiple closed between 0.87 and 0.93, a total of 203 days with a full year of data after them.
Bitcoin was higher one year later on 119 of those days, or about 59%. The median one-year change was a gain of roughly 26%.
The shorter view is weaker. Across 224 days with six months of follow-through data, the median six-month change was a loss of about 17%, largely because many of those days fell in the 2018 and 2022 bear markets.
Readings near 0.90 in 2019, 2020, 2023 and 2024 were followed by strong one-year gains. Those in 2021 and 2022 were followed by further declines. These figures overlap heavily, because neighboring days share most of the same outcome, so they describe a handful of episodes rather than hundreds of independent signals.
The honest takeaway is that a sub-1.0 multiple has not guaranteed an immediate rebound. Over longer holding periods, though, buying below trend has more often paid off than not.
What to Watch Next
The first marker is the 200-day average near $72,900. A daily close back above it would return the multiple to 1.0 and repair the trend break of November 12.
The second is the slope of the average. If it keeps flattening rather than falling, it suggests the long-term trend is pausing rather than rolling over.
The third is the floor. Past bear-market lows clustered around 0.48 to 0.61, a range that today would sit far below current prices.
For long-term holders, we believe the bitcoin Mayer Multiple tells a constructive story. Price is trading at a discount to its 200-day trend after a cycle that never overheated, and that has historically been a more comfortable place to accumulate than to sell.
This article is for information only and is not investment advice. Past indicator readings do not guarantee future returns.
DC Forecasts is a leader in many crypto news categories, striving for the highest journalistic standards and abiding by a strict set of editorial policies. If you are interested to offer your expertise or contribute to our news website, feel free to contact us at [email protected]












Discussion about this post