



The Bitcoin price outlook heading into the second week of November is a story of patience, not panic.
BTC is holding near $75,800 on Sunday, Nov 8, after a week in which US spot Bitcoin ETFs saw roughly $1.28 billion in net outflows.
That is a meaningful number, and we will not pretend otherwise.
Yet the price has barely moved over the weekend, network security sits near record territory and Bitcoin still commands almost 60% of the entire crypto market.
The bigger question now is whether this quiet weekend is the base from which the next leg higher begins.
What Happened to Bitcoin This Week?
CoinGecko’s daily snapshots (00:00 UTC) put BTC at $77,521 on Nov 1 and $75,776 on Nov 8, a decline of about 2.3% over the week.
The path was anything but flat.
Bitcoin dipped to $76,709 on Nov 3, then surged to $80,443 by the Nov 5 snapshot in the days after the US midterm elections.
That rally faded on Nov 5 and Nov 6, and the price has since settled into a tight range around $75,800.

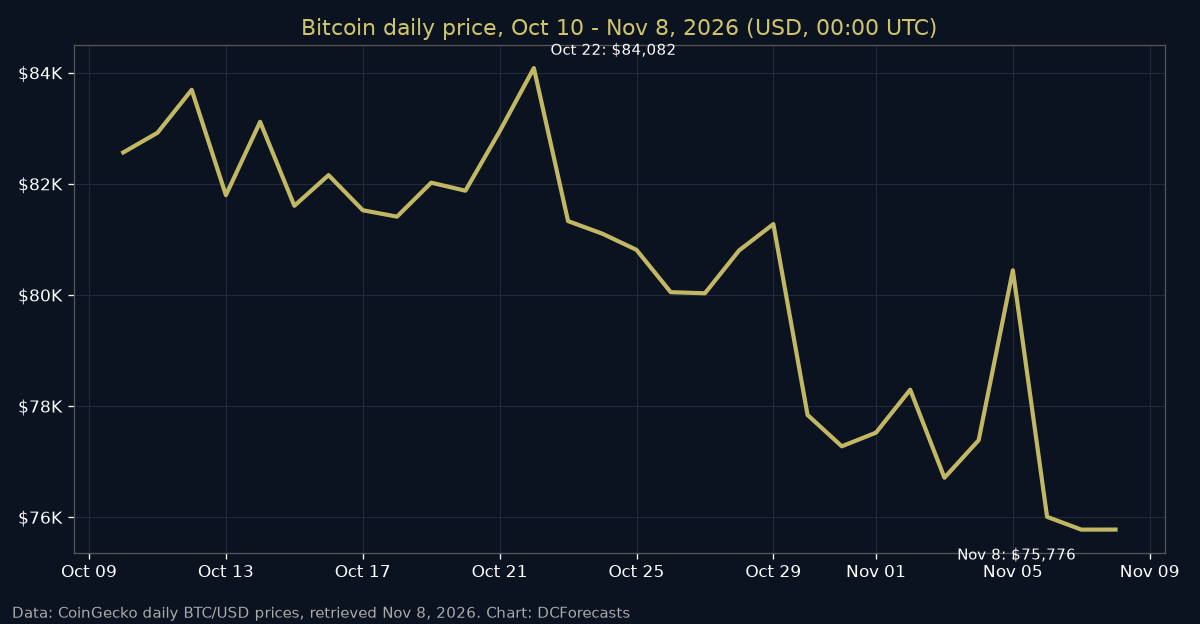
Zooming out, the chart shows the latest leg lower began after the Oct 22 snapshot of $84,082.
From there to today is a pullback of roughly 9.9%, which is well within the range of ordinary corrections in a Bitcoin bull market.
We noted similar resilience when we covered the $430 million ETF outflow day earlier this week.
Bitcoin Price Outlook: What Are ETF Flows Telling Us?
Institutional flows are the clearest reason for the recent softness.
According to Farside Investors data, US spot Bitcoin ETFs recorded net outflows of $398.6 million on Nov 2, $115.6 million on Nov 3, $430.2 million on Nov 5 and $411.9 million on Nov 6.
Nov 4 was the exception, with $74.6 million of net inflows on the day after the midterm vote.
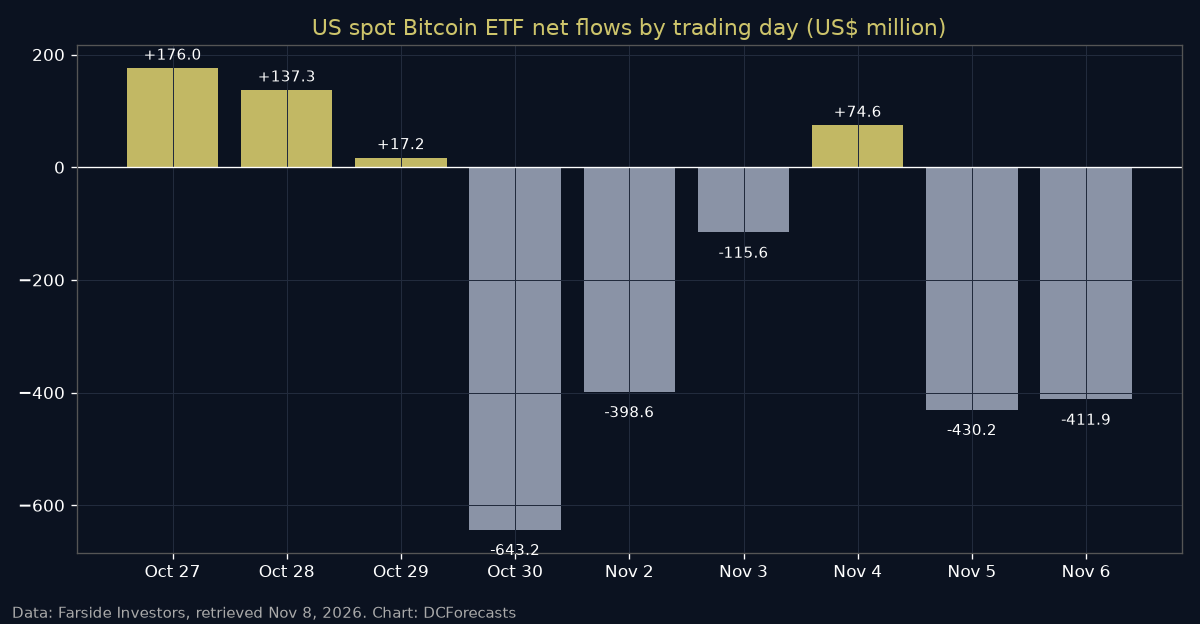
Added together, that is about $1.28 billion leaving the funds in five trading days.
Context matters, though.
The same Farside data shows cumulative net inflows of roughly $55.8 billion since the ETFs launched in January 2024.
In other words, one heavy week has trimmed only a small slice of the capital that has flowed in over almost three years.
We believe the more telling detail is that the price held near $76,000 while those outflows were absorbed.
Why Bitcoin’s Network Strength Still Matters
Price is only one part of the picture.
Mining data from mempool.space shows the Bitcoin network’s estimated hashrate near 998 EH/s, with mining difficulty around 148.4 trillion as of Nov 8.
That is close to the 1,000 EH/s mark, a level we explored in our recent look at Bitcoin difficulty near 148T.
Miners do not commit that much computing power to a network they expect to fade.
Their investment in hardware and energy reflects long-term confidence, even when the daily price chart is choppy.
Is Bitcoin Still Leading the Crypto Market?
Yes, and by a wide margin.
CoinGecko’s global data shows Bitcoin dominance at about 60.0% on Nov 8, with the total crypto market valued near $2.54 trillion.
When investors reduce risk, capital tends to concentrate in the largest and most liquid asset.
That pattern is visible again, and it fits the trend we described when Bitcoin dominance approached 59%.
Trading activity has also cooled sharply.
CoinGecko’s 24-hour volume reading fell from about $43.8 billion in the Nov 6 snapshot to roughly $10.9 billion on Nov 8.
Lower weekend volume usually means fewer forced sellers, which can help a market find its footing.
What Levels Should Bitcoin Investors Watch Next?
The first area to watch is the $75,000 to $76,000 zone, where BTC has stabilised for three consecutive daily snapshots.
Holding that zone would suggest the selling seen earlier in the week has largely run its course.
On the upside, $80,000 is the obvious psychological marker.
From $75,776, a return to $80,000 requires a gain of about 5.6%, which is roughly the size of the move Bitcoin made between Nov 3 and Nov 5.
Beyond that, the Oct 22 snapshot near $84,082 would need an advance of about 11%.
These are reference points from the data, not forecasts.
Our watch list for the coming days:
- Daily ETF flow figures, especially whether outflows slow or flip back to inflows.
- Whether BTC holds the $75,000 area on a daily closing basis.
- Hashrate trends as the next difficulty adjustment approaches.
- Trading volume when US markets reopen on Monday.
Can Bitcoin Turn This Pause Into a Recovery?
We believe the setup is more constructive than the weekly headline numbers suggest.
A week of heavy ETF selling produced a modest weekly decline, the network is near record security, and Bitcoin’s share of the crypto market keeps growing.
None of that guarantees a rally next week.
But it does show a market absorbing pressure rather than breaking under it.
For long-term holders, the core thesis is unchanged: a fixed supply of 21 million coins, institutional infrastructure that keeps maturing and adoption that keeps widening.
A return of steady ETF inflows would be the clearest signal that the next chapter has begun.
The coming days will reveal whether this weekend calm was the base Bitcoin needed.
DC Forecasts is a leader in many crypto news categories, striving for the highest journalistic standards and abiding by a strict set of editorial policies. If you are interested to offer your expertise or contribute to our news website, feel free to contact us at [email protected]












Discussion about this post