



Every Bitcoin bear market feels like the worst one while you are living through it. The numbers say this one has been the mildest of the modern era so far.
We measured each of the last three cycles from its highest daily close to its lowest, using Coinbase Exchange BTC-USD closing prices. The 2018 bear market took Bitcoin down 83.8%. The 2022 bear market cut it by 76.7%. The current cycle’s deepest close, on June 30, 2026, was 53.1% below the peak.
That is roughly 24 to 31 percentage points shallower than the two declines before it.
We used daily closes in UTC because brief intraday wicks on a single exchange can exaggerate a move. Intraday lows were slightly deeper in every cycle, but measuring all three the same way keeps the comparison fair.
How Deep Did Each Bitcoin Bear Market Go?
Here is the evidence, cycle by cycle, based on daily closes rather than intraday spikes.
- 2017 to 2018: peak close of $19,650 on December 16, 2017. Low close of $3,183 on December 15, 2018, 364 days later. Decline of 83.8%.
- 2021 to 2022: peak close of $67,555 on November 8, 2021. Low close of $15,760 on November 21, 2022, 378 days later. Decline of 76.7%.
- 2025 to 2026: peak close of $124,720 on October 6, 2025. Lowest close so far of $58,524 on June 30, 2026, 267 days later. Decline of 53.1%.
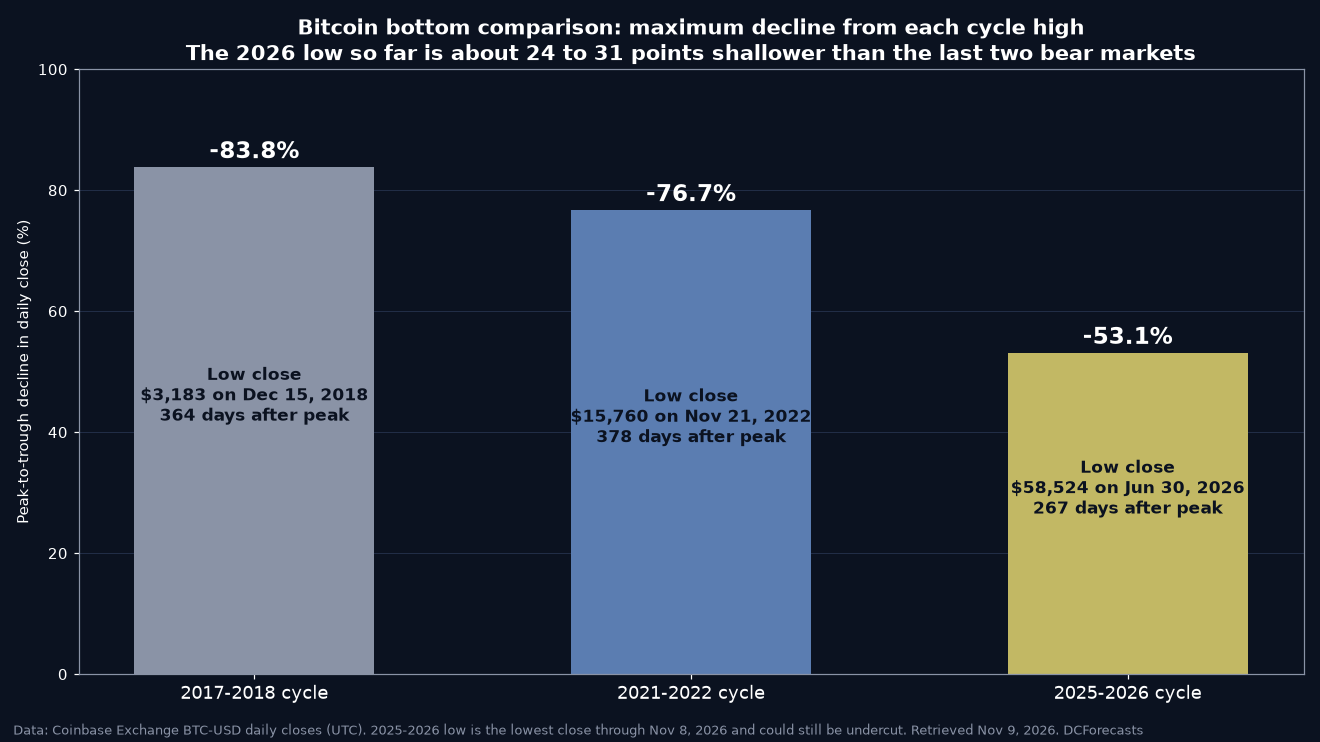
Each bear market has also bottomed at a far higher level. The 2026 low of $58,524 was only 13.4% below the 2021 peak of $67,555. The 2022 low of $15,760, by comparison, was 19.8% below the 2017 peak.
In plain terms, Bitcoin’s floors keep rising, and the distance it falls from each new high keeps getting smaller.
Where Bitcoin Stands 398 Days After the Peak
Comparing the cycles at the same point in time makes the gap even clearer.
Bitcoin closed at $74,754 on November 8, 2026, which is 398 days after the October 2025 high. That leaves it 40.1% below the peak.

At day 398 of the previous two cycles, the picture was much darker. In January 2019, Bitcoin was 81.6% below its 2017 high. In December 2022, it was 74.7% below its 2021 high.
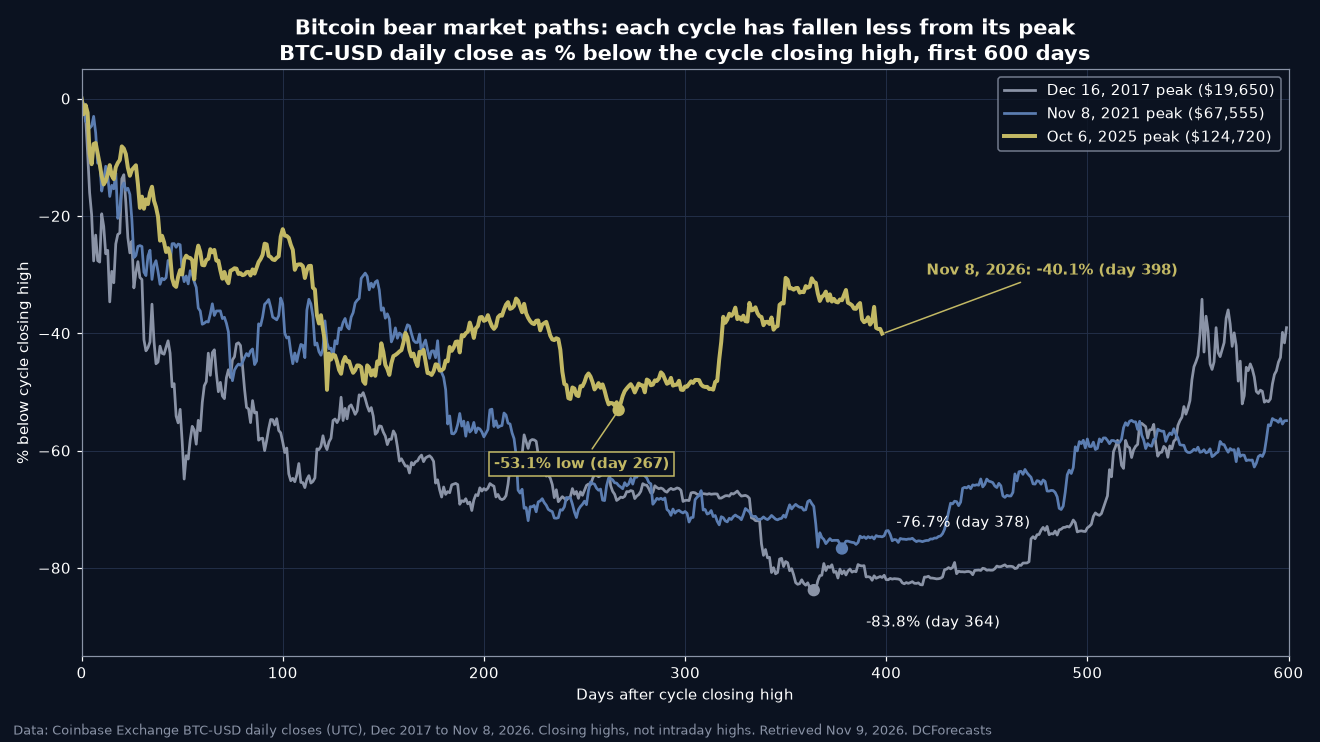
The paths also diverge after the halfway mark. One year after their peaks, the 2017 and 2021 cycles were still sliding, sitting 83.7% and 72.5% below their highs. One year after the 2025 peak, on October 6, 2026, Bitcoin was only 31.4% below.
The rebound from the June low has been meaningful too. Bitcoin rallied 48.0% from its June 30 close to $86,595 on September 21, and even after the recent pullback it remains 27.7% above that low.
Time spent in deep losses tells the same story. In the first 398 days after each peak, Bitcoin closed at least 50% below its high on 333 days in the 2017 cycle and 217 days in the 2021 cycle. In the current cycle, that has happened on just 15 days.
Why Bitcoin Bear Markets May Be Getting Shallower
The data above is fact. What follows is our interpretation, and readers should weigh it accordingly.
The most obvious change is who owns Bitcoin. The 2018 and 2022 drawdowns played out in a market dominated by retail traders and leveraged crypto lenders. This cycle has been the first with U.S. spot Bitcoin ETFs, which the SEC approved in January 2024.
That shift is visible in the holdings. BlackRock’s Bitcoin position recently reached 801,033 BTC at quarter-end, its largest yet. Long-term holders of that kind tend to absorb selling that would once have cascaded much further.
Market size matters as well. A bigger, more liquid asset generally needs far more capital to push it down by the same percentage, which is consistent with each drawdown being smaller than the one before.
The halving rhythm has stayed remarkably steady through all of this. Each of the last three cycle peaks arrived 17 to 18 months after a halving, in December 2017, November 2021 and October 2025.
What Could Still Go Wrong?
Honest analysis means flagging the limits.
Three cycles is a small sample. The June low is the lowest close so far, not a confirmed bottom, and it could still be undercut. The previous two bear markets bottomed after 364 and 378 days, and this one is already past day 398, so its timing does not line up neatly with history.
Bitcoin is also still 40% below its high, and 2026 has been a volatile year. Shallower declines do not mean painless ones.
The Bottom Line on This Bitcoin Bear Market
Measured against its own history, this Bitcoin bear market has been the gentlest yet. The deepest close was a 53.1% decline, compared with 76.7% and 83.8% in the previous two cycles, and the price has held well above that low for more than four months.
We see that as evidence of a maturing asset with a broader, more patient ownership base. For a closer look at the seasonal side of this cycle, see our analysis of Bitcoin’s November returns and the 4 year cycle.
Past cycles do not guarantee future results. But if the pattern of rising floors holds, the next Bitcoin bottom could once again sit higher than the last.
DC Forecasts is a leader in many crypto news categories, striving for the highest journalistic standards and abiding by a strict set of editorial policies. If you are interested to offer your expertise or contribute to our news website, feel free to contact us at [email protected]












Discussion about this post