



Bitcoin trading volume just had its busiest day in more than five months, and the timing tells us a lot about who was selling and who was buying.
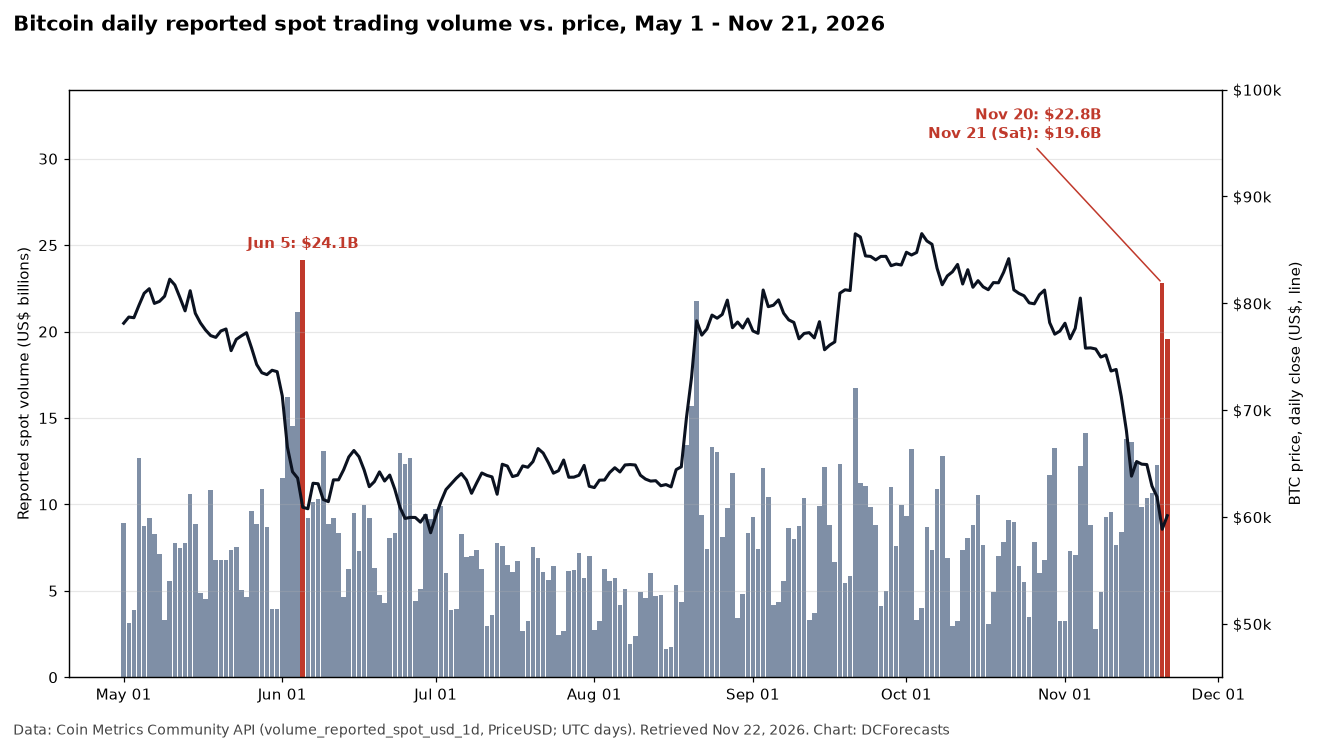
Exchanges reported $22.8 billion in Bitcoin spot volume on Friday, Nov. 20, according to Coin Metrics data. That is 2.6 times the prior 30-day average of $8.7 billion.
Saturday did not calm things down. Spot volume reached $19.6 billion on Nov. 21, the heaviest weekend session since Jan. 31.
For Bitcoin investors, the most interesting detail is the last time volume ran this hot. It was June 5, with BTC closing at $60,908, close to where it trades today.
The bigger question is whether this surge marks sellers running out of coins, or just a loud stop on the way lower.
How Big Was the Bitcoin Trading Volume Spike?
Coin Metrics tracks reported spot volume across the exchanges it covers, measured in US dollars per UTC day. On that basis, Nov. 20 was the largest day since June 5, when $24.1 billion changed hands.
The jump stands out against a quiet autumn. October averaged about $7.4 billion a day. The first 21 days of November averaged $10.5 billion, lifted by the final two sessions.
Price action explains the rush. On Coinbase, BTC fell from $61,912 to a Nov. 20 low of $57,655 and closed at $58,815.
Saturday brought the flush. Bitcoin dropped to $55,106 on Coinbase, then rallied to $60,883 and closed the UTC day at $60,086. As we covered when the Bitcoin rebound reclaimed $60,000, that recovery took only hours.

BTC was trading near $60,200 early on Nov. 22.
Why Heavy Volume Matters in a Sell-Off
Every coin sold has a buyer. When volume triples during a drop, a large amount of Bitcoin moves from nervous hands to buyers willing to take the other side.
That is the classic picture of Bitcoin capitulation. Forced sellers, liquidated traders and short-term holders exit together, and the price finds a level where demand absorbs them.
The weekend detail strengthens that reading. Weekend sessions usually carry much less volume, as we noted in our look at Bitcoin weekend trading. A $19.6 billion Saturday suggests real repositioning, not just thin-market noise.
Still, volume describes activity, not direction. It cannot tell us on its own whether the low is in.
What Happened After Past Bitcoin Spot Volume Surges?
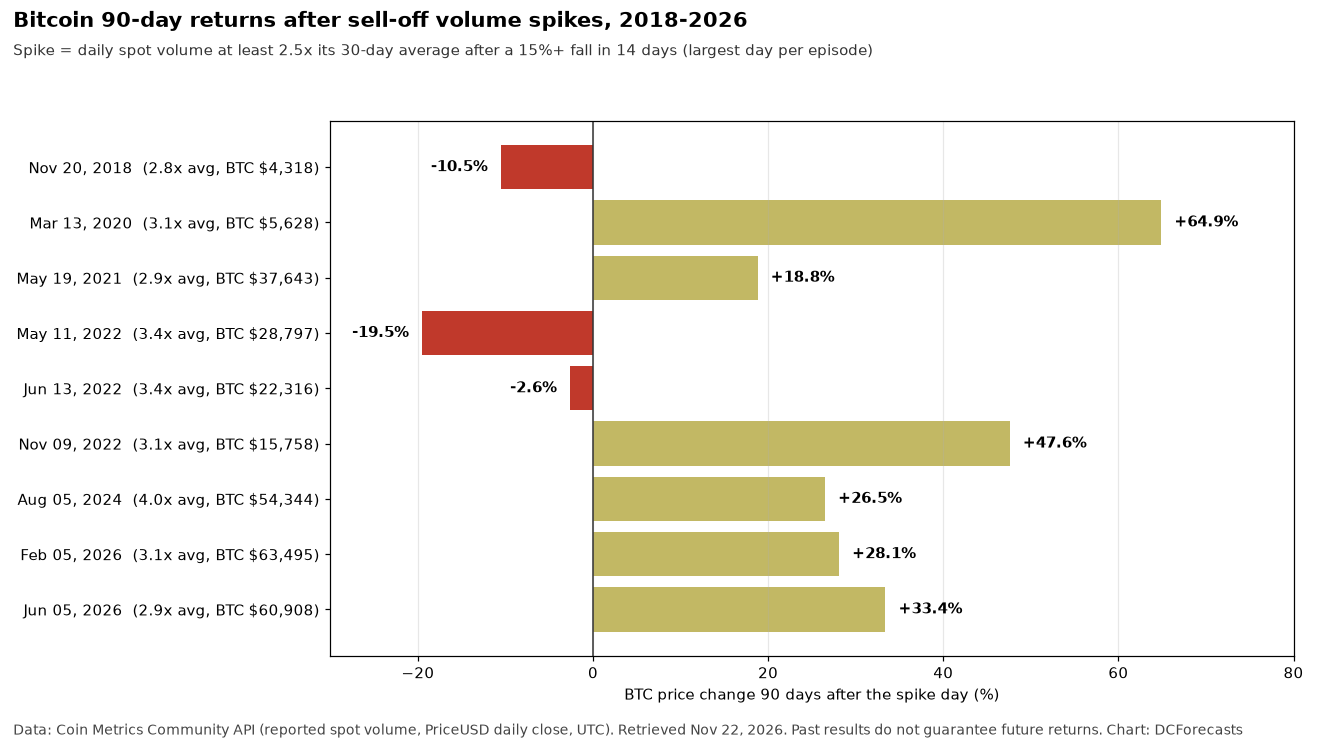
To test the pattern, we screened Coin Metrics data from 2018 onward. We looked for days when spot volume reached at least 2.5 times its 30-day average after Bitcoin had fallen 15% or more in 14 days.
Nov. 20 qualifies, with a 22.4% drop over the prior two weeks. Before it, the screen finds nine separate episodes, using the biggest day in each.
Ninety days later, Bitcoin was higher in six of the nine. The median 90-day change was a gain of 26.5%.
- March 13, 2020: up 64.9% after 90 days.
- Nov. 9, 2022: up 47.6%. That day’s close was the lowest of the following 90 days.
- Aug. 5, 2024: up 26.5%.
- Feb. 5, 2026: up 28.1%, and BTC never closed below that day’s $63,495 in the following 90 days.
- June 5, 2026: up 33.4%.
The record also contains clear failures. Nov. 20, 2018 was followed by a 10.5% decline over 90 days, May 11, 2022 by a 19.5% fall, and June 13, 2022 by a 2.6% dip.
The Pattern Is Constructive, Not a Guarantee
One honest caveat stands out. In seven of the nine past cases, Bitcoin closed below the spike-day price at some point in the next 90 days.
Some of those retests were small. After June 5, BTC slipped 3.9% to $58,525 on June 30, then climbed to a 33.4% gain by early September.
Others were painful. After the May 2022 spike, price fell another 34% by June 18 of that year.
We believe context is the common thread. Two of the three failures came in mid-2022, while a long bear market was still unfolding, and the strongest outcomes followed short, violent flushes.
This time, Bitcoin hit heavy volume near the same $58,000 to $61,000 zone where buyers stepped in during June and July. That shared floor deserves attention.
Can Bitcoin Turn This Flush Into a Bottom?
We would watch three things in the coming sessions.
- Whether BTC holds Saturday’s $55,106 Coinbase low on any retest.
- Whether daily volume fades back toward $9 billion to $10 billion as the price stabilizes, which would suggest selling is easing.
- Whether a move back above $61,912, the Nov. 20 open, comes on steady rather than panicked volume.
For us, the key takeaway is that a Bitcoin bottom is usually built on exactly this kind of exchange of coins, from weak holders to patient ones.
The supply schedule has not changed, and the infrastructure for long-term buyers keeps growing. If the $55,000 area holds, this week’s $22.8 billion handover may later look like the moment the selling ran out of fuel.
DC Forecasts is a leader in many crypto news categories, striving for the highest journalistic standards and abiding by a strict set of editorial policies. If you are interested to offer your expertise or contribute to our news website, feel free to contact us at [email protected]












Discussion about this post