



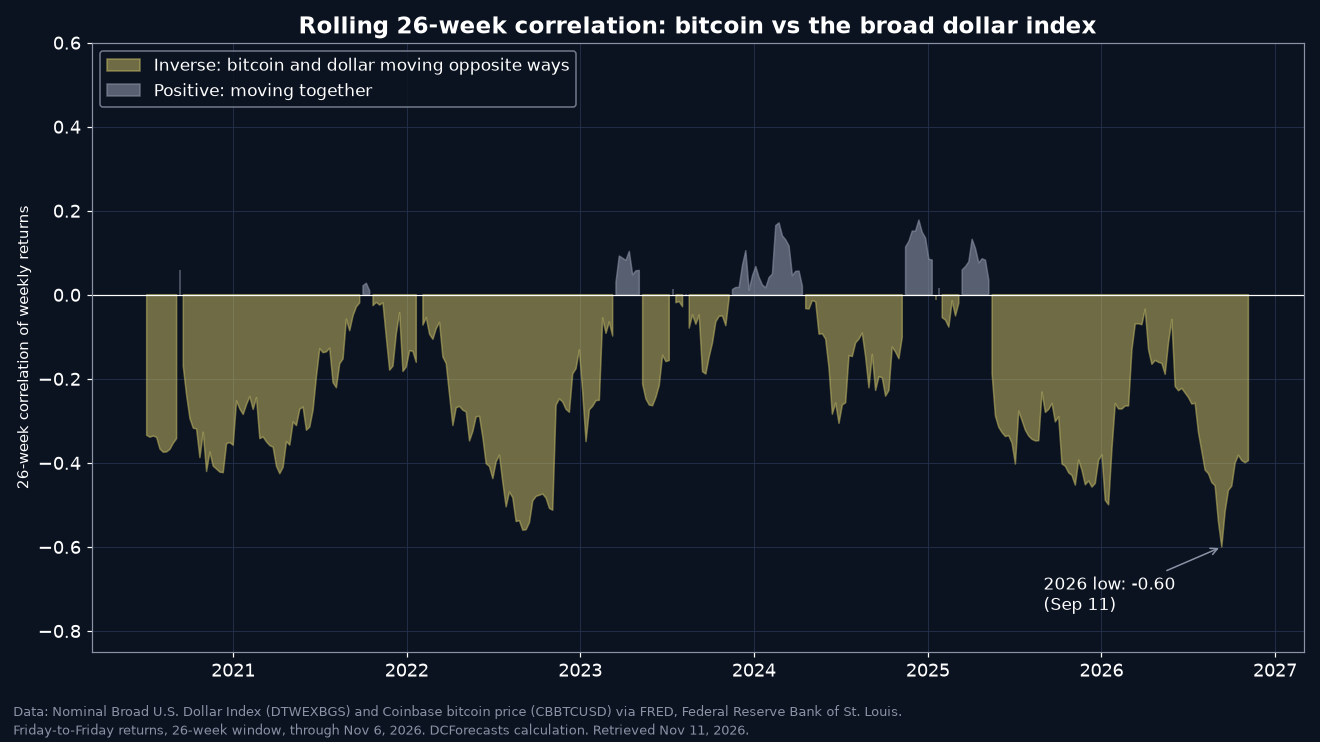
Bitcoin has rarely moved against the U.S. dollar as consistently as it did this autumn. In mid-September, the link between the two reached its most inverse level in more than six years of weekly data, and it has stayed firmly negative since.
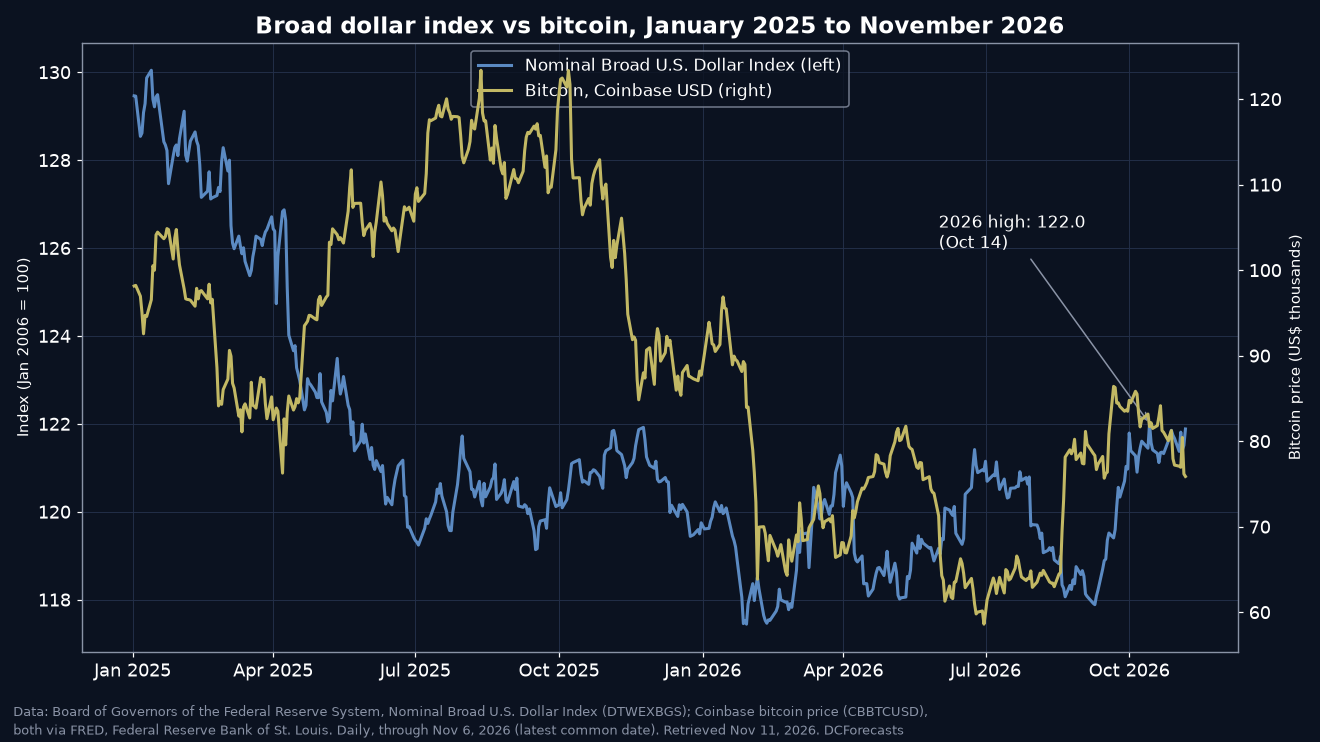
That matters now because the dollar is sitting near its 2026 high. The Federal Reserve’s Nominal Broad U.S. Dollar Index, which tracks the greenback against the currencies of major U.S. trading partners, closed at 121.88 on November 6. Its high for the year was 122.0 on October 14.
The dollar index is back near its 2026 high
The broad dollar index started 2026 at 119.75 and fell to a low of 117.44 on January 29. Since then it has climbed 3.2% from early May and finished the latest week up 1.8% for the year, according to data the Fed publishes in its H.10 foreign exchange release.
Seen over a longer window, the move is more modest. The index is still about 6.3% below its January 13, 2025 peak of 130.04, and it is up only 0.15% from a year ago.
Bitcoin’s path has been bumpier. Based on Coinbase prices published through FRED, it closed at $75,860 on November 6, down 13.5% for the year. Yet it was also 18% above its level of three months earlier, when it traded near $64,300 in early August.
A record inverse correlation in September
To measure how closely the two move, DCForecasts calculated the correlation of their weekly returns over rolling 26-week windows, using Friday closes. A reading of -1 would mean they always move in opposite directions, and +1 would mean they always move together.
On September 11, 2026, that measure hit -0.60. It is the most negative reading since the series begins in July 2020, beating the previous low of -0.56 set on September 2, 2022. As of November 6, it stood at about -0.40.
The pattern holds in the calendar-year numbers too. The correlation of weekly returns was negative in every year from 2020 through 2026, ranging from -0.07 in 2024 to -0.37 in 2025. Across the full period it averaged -0.23.
What the inverse link does and does not say
A negative correlation is a tendency, not a rule. Over the 14 weeks since early August, bitcoin and the dollar moved in opposite directions in eight weeks. Over that same stretch both actually rose, with the dollar up about 2% and bitcoin up about 18%, which shows how much bitcoin can outrun the currency it is priced in.

There are also good reasons the relationship leans negative. Bitcoin is priced in dollars, so a weaker dollar mechanically lifts its price for holders of other currencies. A softer dollar also tends to accompany easier global financial conditions, the kind of liquidity backdrop explored in our recent look at record M2 money supply.
Correlations can also shift quickly. The 26-week figure briefly turned positive in 2023, 2024 and early 2025, and bitcoin’s relationship with equities has been changing at the same time. Our analysis of bitcoin’s correlation with the S&P 500 found that link at a 2026 high.
Why dollar strength is worth watching for bitcoin
The dollar’s recent climb has coincided with shifting expectations around U.S. inflation and interest rates. October’s consumer price report showed core prices still rising 0.3% a month, which has kept pressure on rate expectations.
For bitcoin holders, the useful takeaway is that the dollar has been one of the clearer macro signals this autumn. With the inverse link near record strength, any easing in dollar strength from these levels has historically lined up with a friendlier backdrop for bitcoin. The dollar is near its 2026 high but still well below its early-2025 peak, so it has room to move either way.
None of this guarantees a direction. But it gives investors a concrete way to read the macro tape. When the broad dollar index stalls near 122, bitcoin’s weekly moves have tended to lean the other way, and that relationship has rarely been stronger than it is in 2026.
How we calculated it
We used the Federal Reserve’s daily Nominal Broad U.S. Dollar Index (series DTWEXBGS) and the Coinbase bitcoin price in U.S. dollars (series CBBTCUSD), both downloaded from FRED. We matched the two on common trading days, took Friday-to-Friday percentage changes and computed a 26-week rolling Pearson correlation. The latest common data point is November 6, 2026, because the dollar index is published with a short lag.
DC Forecasts is a leader in many crypto news categories, striving for the highest journalistic standards and abiding by a strict set of editorial policies. If you are interested to offer your expertise or contribute to our news website, feel free to contact us at [email protected]












Discussion about this post