



Ether has slipped to its weakest level against bitcoin in almost four months, as the second-largest crypto asset falls faster than the first during this month’s market pullback.
One ether bought about 0.0279 BTC on Wednesday morning, according to CoinGecko data. That is the lowest ETH/BTC reading since July 14, 2026, and about 7.6% below the 0.0301 BTC it fetched on November 5.
In dollar terms, ether traded near $2,054, down 2.3% over 24 hours and edging toward the $2,000 mark. Bitcoin held near $73,600, down about 1% over the same period.
The gap between the two moves is the story. When the market turns cautious, money has been leaving ether faster than it leaves bitcoin.
ETH/BTC Gives Back Its Summer Recovery
The ETH BTC ratio has had a rough year. It peaked at about 0.0361 BTC on January 20, 2026, then slid to a low near 0.0248 BTC on June 7.
A rebound followed over the summer. By September the ratio averaged close to 0.032 BTC, and many traders treated that as a sign ether was regaining ground.
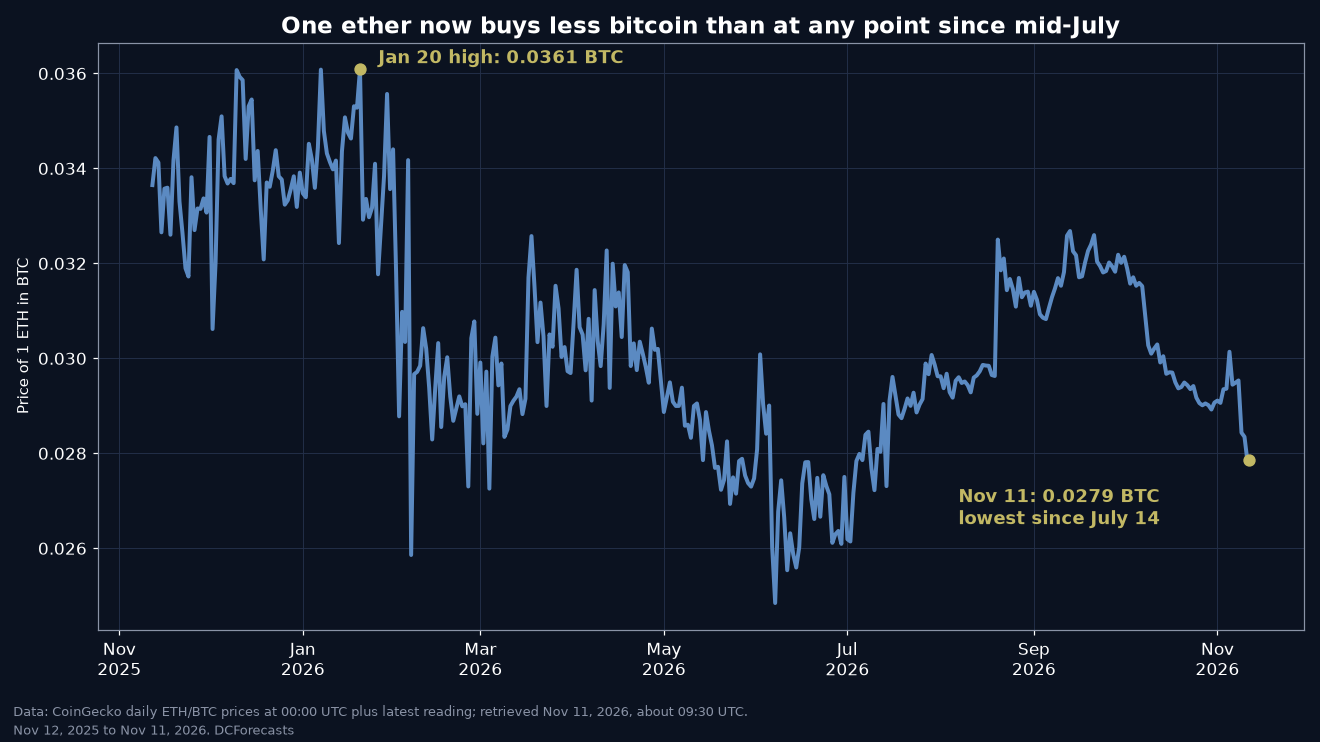
Most of that recovery has now faded. The ratio has fallen in four of the last seven daily readings, sliding from 0.0295 on November 8 to 0.0284 on November 9 and 0.0278 at the start of November 11.
Measured from a year ago, when one ether was worth about 0.0337 BTC, the ratio is down roughly 17%. From the January peak, the decline is about 23%.
Ethereum vs Bitcoin Over the Past Year
Both assets are lower than they were 12 months ago, but by very different amounts. CoinGecko prices show bitcoin down about 29% since November 12, 2025, from roughly $103,100 to $73,600.

Ether has fallen about 40% over the same period, from around $3,416 to $2,054. Ether has generally fallen harder than bitcoin during the year’s selloffs.
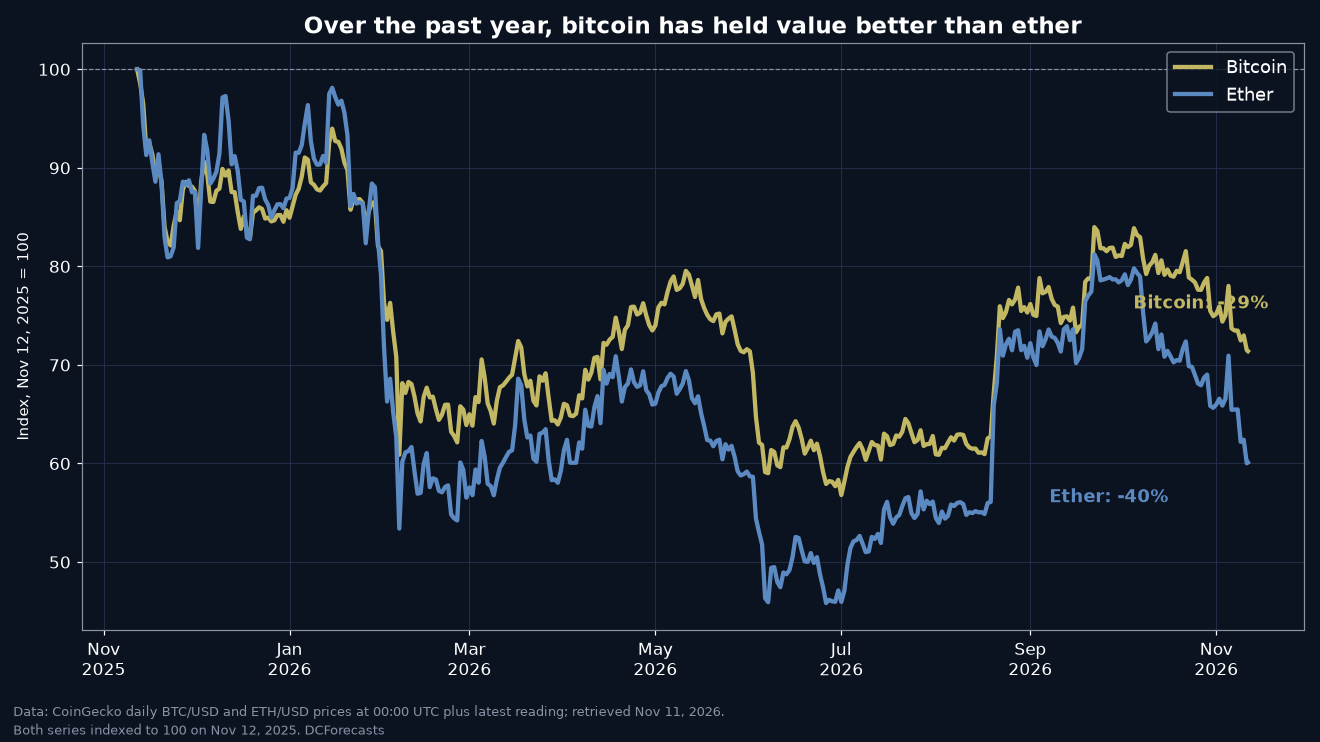
The pattern was clearest in late spring. Between May and early July, bitcoin’s index held mostly in the 57 to 80 range while ether’s fell as low as 46, before both recovered in August.
That gap has opened again this month. It suggests investors are treating bitcoin as the steadier holding when they cut risk.
Why Money Keeps Choosing Bitcoin
Size is part of the answer. Bitcoin’s market value stands near $1.48 trillion, about 4.1 times ether’s $359 billion, and its 24-hour trading volume of roughly $33 billion was more than double ether’s $14 billion.
Deeper markets tend to absorb selling more smoothly. That helps explain why bitcoin’s share of the total crypto market sits around 60.5%, according to CoinGecko, while ether’s is about 10.3%.
We covered that trend when bitcoin dominance neared 60% earlier this month, and the latest ETH/BTC slide is another sign it has not reversed.
Fund flows add to the picture. As we reported, BlackRock’s spot ether ETF has shed $1.9 billion even as a rival fund kept taking in money. Persistent outflows from the largest ether product weigh on the ETH to BTC ratio during weak stretches.
Bitcoin’s simpler story also plays a role. Its fixed 21 million coin supply and role as a reserve asset give investors a clear reason to hold it through drawdowns, while ether’s value depends more on network activity and fees.
The Ratio Month by Month
Month-end readings from CoinGecko, taken at 00:00 UTC on the first day of each following month, show how uneven the path has been. One ether was worth about 0.0347 BTC at the end of November 2025 and 0.0318 BTC at the end of January 2026, despite the mid-January peak.
The slide continued through spring, with month-end readings near 0.0299 in February, 0.0289 in April and 0.0281 in May. June closed near 0.0262, the weakest month-end of the year.
The summer rebound lifted it to about 0.0321 by the end of September. October gave back much of that, ending near 0.0291, and November so far has pushed it down to 0.0279.
Ether’s shorter-term numbers look similar. CoinGecko data shows it down about 11.5% over seven days and 19.5% over 30 days. At $2,054, it sits roughly 58% below its all-time high of $4,946, set on August 24, 2025.
What Could Turn the Ratio Around
Ether has bounced against bitcoin before. The ratio rose about 31% from its June low to its September highs, so a sharp reversal is possible if risk appetite returns.
Traders will watch whether ether can hold the $2,000 area in dollar terms. A break below it would likely keep pressure on the ratio, while a firm defense could slow the slide.
Liquidity across the market matters too. Stablecoin supply has been rising relative to bitcoin, as our stablecoin supply ratio analysis showed, and that sidelined cash could support both assets once it moves back into crypto.
The Bigger Takeaway for Bitcoin Holders
For now, the data favors bitcoin. Over one week, three months and a full year, the ETH/BTC chart points the same way, with bitcoin holding value better than its largest rival.
That does not mean ether’s story is over. It does show that in a nervous market, investors keep turning to the asset with the deepest liquidity, the longest track record and a supply schedule that never changes.
DC Forecasts is a leader in many crypto news categories, striving for the highest journalistic standards and abiding by a strict set of editorial policies. If you are interested to offer your expertise or contribute to our news website, feel free to contact us at [email protected]












Discussion about this post