



This bitcoin correction now has a clear deadline. Bitcoin slipped below its short-term holder cost basis, which Bitfinex analysts put at $75,717, on Nov. 8, and history says the next ten days matter more than the next ten dollars.
In 11 of the 14 comparable breaks since 2016, Bitcoin climbed back above that level within two weeks, according to the exchange’s Nov. 11 Bitfinex Alpha report.
Bitcoin traded near $73,511 on Coinbase on Thursday morning. That leaves it roughly 3% below the line.
The bigger question is whether this episode joins the 11 quick recoveries or the three slower ones, and the two-week mark falls on Nov. 22.
What the Short-Term Holder Cost Basis Tells Us
The short-term holder cost basis is the average price paid for coins that moved within the last 155 days. In simple terms, it is the breakeven point for Bitcoin’s newest buyers.
When price sits above it, recent buyers are in profit and tend to hold. When price drops below it, many of them are underwater, and some sell into any rally that brings them back to breakeven.
That is why the level often acts like a ceiling until fresh spot demand arrives.
Bitfinex said Bitcoin hovered within 0.2% of the line from Nov. 5 to Nov. 7 before closing clearly below it on Nov. 8. After the October inflation report, it dropped to a low of $72,706 on the exchange, about 16.8% below the Sept. 21 high of $87,392.
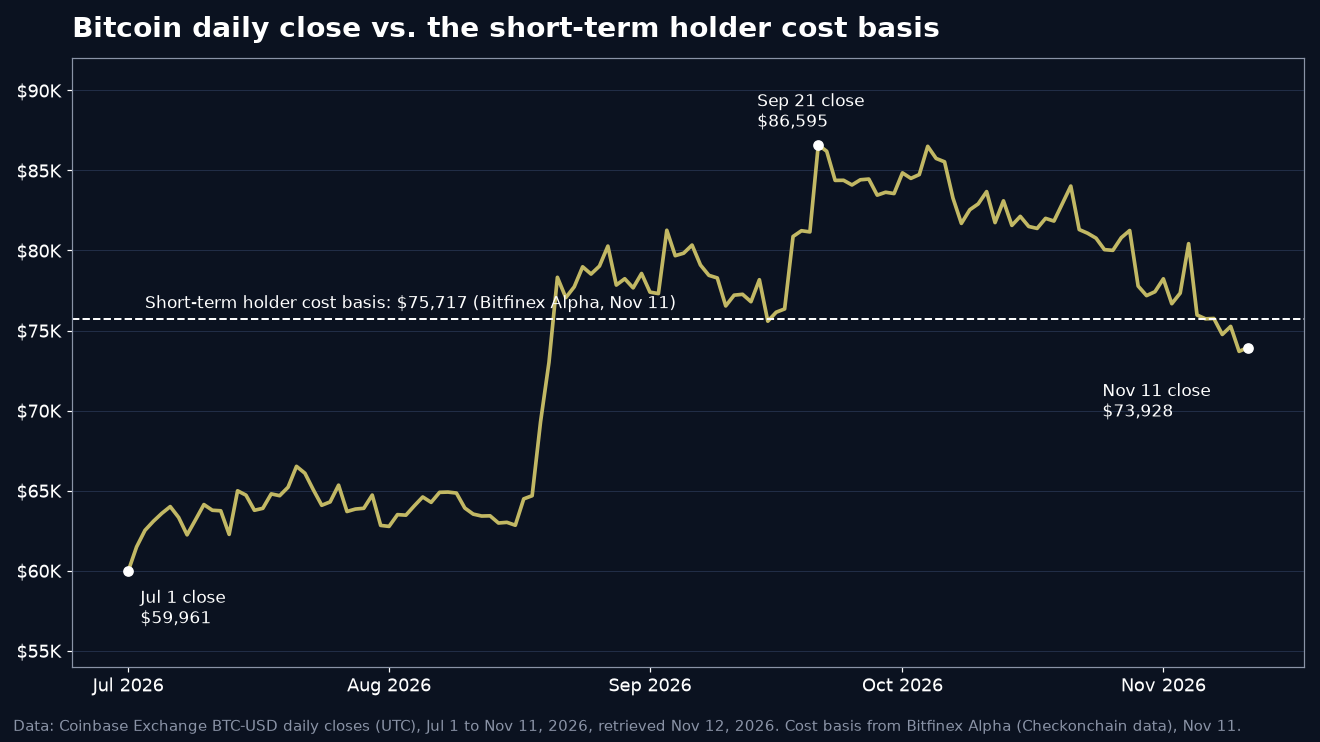
Context matters here. Bitcoin’s daily close on Coinbase was $59,961 on July 1, the low point Bitfinex identifies as the start of this uptrend. Even after the slide, the Nov. 11 close of $73,928 was still about 23% above that level.

As we noted when the 200-week moving average hit a fresh record, the long-term trend markers remain intact beneath this pullback.
Is This Bitcoin Correction Following the Usual Script?
The Bitfinex study counts only breaks that followed at least 60 days above the cost basis. That filter matters, because it isolates moments when an established uptrend first stumbled.
In 11 of those 14 cases, the level was reclaimed within two weeks. In the other three, recovery took 57 to 114 days, and the low over the following 90 days ran 17% to 35% below the cost basis.
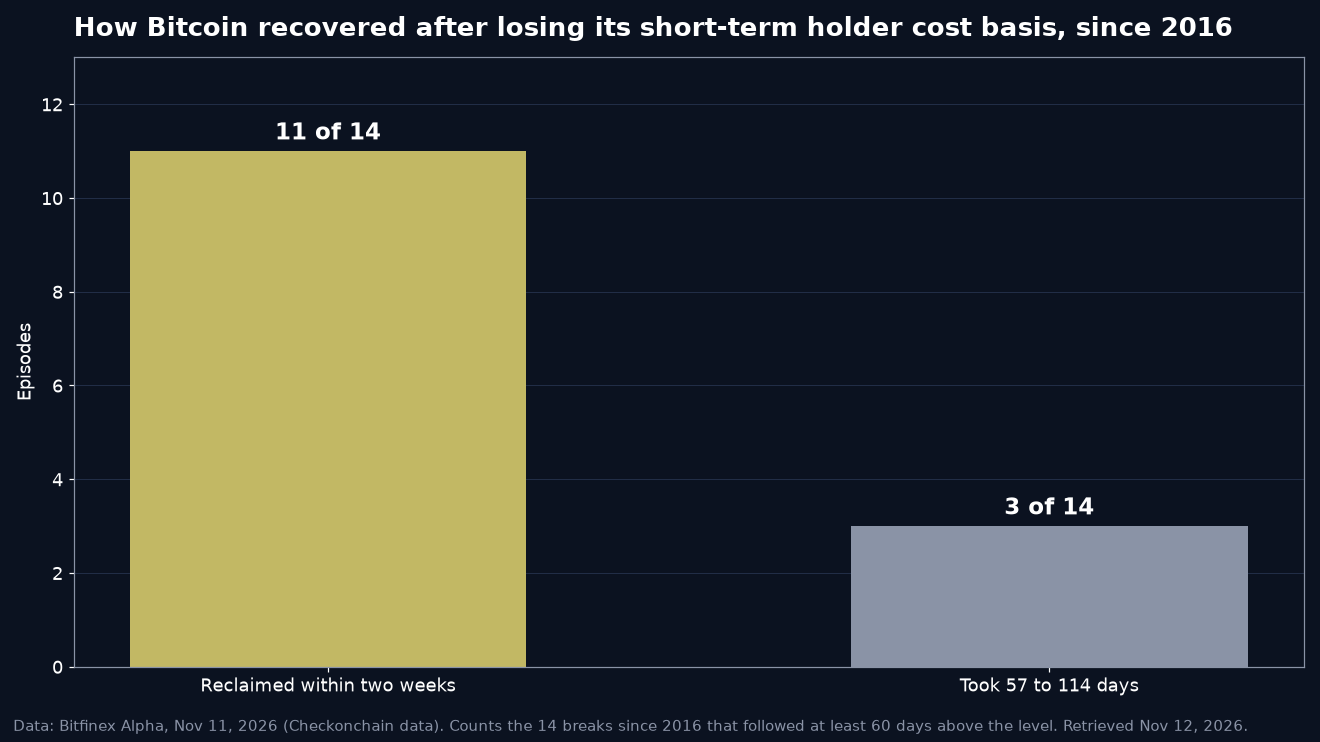
We believe that base rate deserves more attention than it gets. A quick reclaim has been the normal outcome, not the exception, by a margin of almost four to one.
Still, the report flags caution. The share of supply in profit had slipped to 57.9%, below the 58.3% line Bitfinex says has historically separated corrections from deeper resets.
Where Selling Is Coming From, and Where It Is Easing
Recent buyers have been taking small losses rather than panicking. The short-term holder spent output profit ratio fell to 0.989 on Nov. 10, meaning those coins were sold at an average loss of about 1%.
Realized losses across all holders totaled about 172,700 BTC over 12 days. That works out to roughly 14,400 BTC a day, compared with about 45,000 BTC a day during the May to July decline.
In other words, selling is running at less than a third of the pace seen in the last deeper flush.
Meanwhile, buyers have been stepping in lower. Bitfinex estimates the amount of Bitcoin with a cost basis between $70,000 and $75,000 rose by about 233,000 BTC in three days, to 762,000 BTC.
The flip side is that 1.6 million BTC bought between $75,000 and $80,000 now sits at a loss. Any rebound will have to absorb some of that supply.
ETF selling is also fading. U.S. spot funds saw net outflows of $201 million on Nov. 9 and $95 million on Nov. 10, each session smaller than the last, a trend we tracked in our look at shrinking ETF exits this month.
The Signals That Would Confirm a Recovery
Bitfinex laid out a straightforward test. A reclaim of $75,717 together with three consecutive ETF inflow sessions would mark the break as a correction.
Earlier in 2026, outflow runs that ended with three or more straight inflow days were followed by a median 10-session gain of 6.4%, according to the exchange’s Nov. 4 analysis.
For the near term, options priced a one-standard-deviation range of $71,600 to $75,800 for the Nov. 13 expiry. The analysts named a 10-year real yield above 2.8% or a Nasdaq 100 drop below 26,606 as the triggers that could push price toward $70,000 to $71,200.
Our watch list is short: Bitcoin’s daily close against $75,717, daily ETF flows, the 10-year real yield, and Nvidia’s earnings on Nov. 17 ahead of the Anthropic listing on Nov. 19.
Can Bitcoin Reclaim $75,717 Before Nov. 22?
From Thursday’s price, the climb back to the cost basis needs a gain of about 3%. That is a modest move by Bitcoin’s standards, though the report expects rallies toward that line to meet selling until spot demand returns.
For us, the bigger picture remains constructive. Buyers added about 233,000 BTC of cost basis between $70,000 and $75,000 in three days, losses are being realized at a far slower pace than in the summer, and ETF outflows are shrinking session by session.
Bitcoin’s fixed supply and growing institutional plumbing have not changed in the past two weeks.
If the quick-recovery pattern holds, a close back above $75,717 by Nov. 22 could turn this stretch into another reset that set up the next leg higher.
DC Forecasts is a leader in many crypto news categories, striving for the highest journalistic standards and abiding by a strict set of editorial policies. If you are interested to offer your expertise or contribute to our news website, feel free to contact us at [email protected]












Discussion about this post