



The Bitcoin sell-off reached a new stage on Saturday, and it did so on unusually heavy weekend volume. Bitcoin touched $64,978 on Coinbase Exchange, its lowest price since Aug. 19.
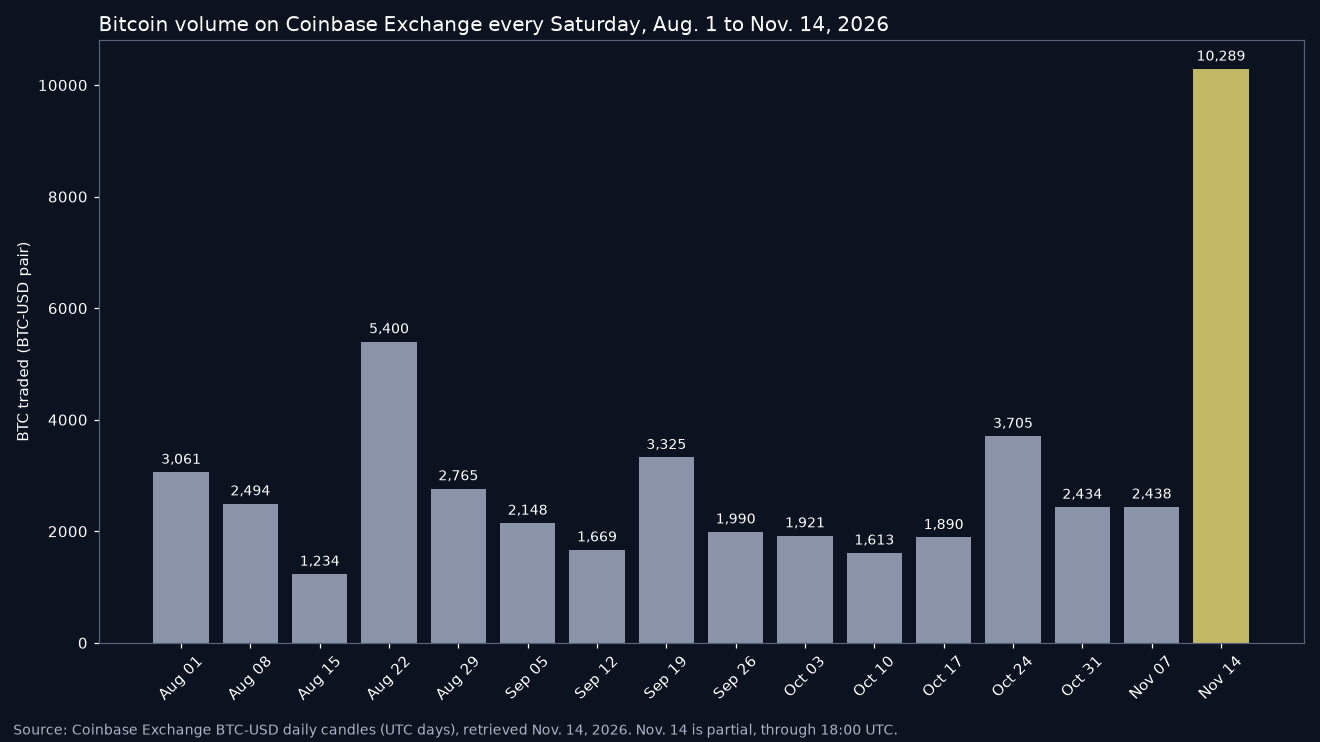
By 18:00 UTC, traders had swapped 10,289 BTC on Coinbase’s BTC-USD market. That is almost four times the average Saturday of the previous 12 weeks, and the day was not over yet.
Weekends are normally the quiet part of the Bitcoin week. This one was not.
For long-term holders, the more interesting question is who is on the other side of all that selling. The last time Bitcoin traded this low, in August, Coinbase’s busiest stretch since early June arrived just as a nearly 40% rally began.
How the Bitcoin Sell-Off Reached $64,978
The slide has been steep. Bitcoin traded as high as $81,130.79 on Coinbase on Nov. 4, so Saturday’s low marks a drop of about 19.9% in ten days.
Friday did much of the damage. Bitcoin opened the session at $71,369.90 and closed at $68,236.54, after we reported on the move below $70,000 and more than $1.6 billion in crypto liquidations.
Saturday added to it. By 18:00 UTC, the price stood at $65,863, about 3.5% below Friday’s close.
Those figures are real, and we will not dress them up. But they also need context.
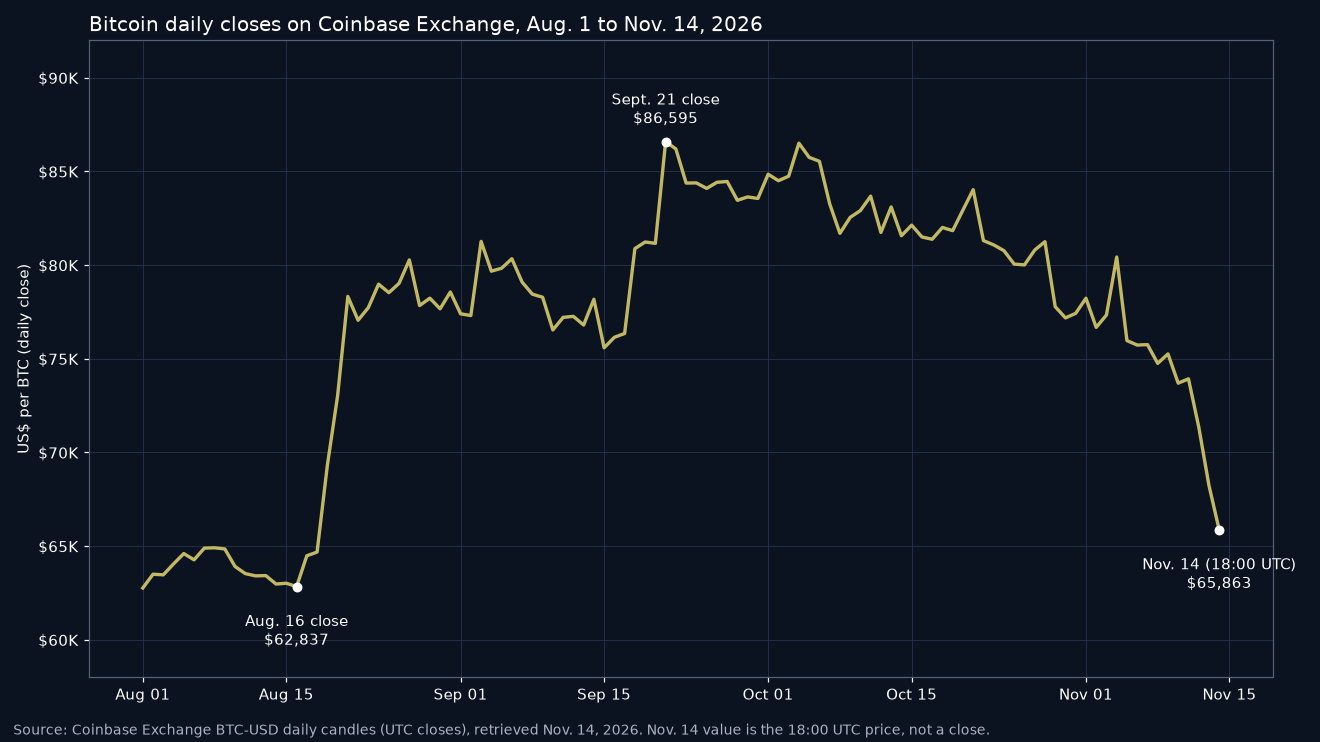
Bitcoin is still about 14% above its 2026 intraday low of $57,717.55, set on July 1. The current pullback has not erased the summer recovery, even if it has given back most of the autumn gains.

Why the Weekend Volume Stands Out
Across the 12 Saturdays from Aug. 22 to Nov. 7, Coinbase’s BTC-USD market averaged about 2,608 BTC of trading. The busiest of them, Aug. 22, reached 5,400 BTC.
Saturday’s partial figure is already nearly double that high. It is also the busiest Saturday since Feb. 7, when 11,252 BTC changed hands, based on Coinbase daily candles going back to May 2024.
Friday was heavy too. Coinbase recorded 16,648 BTC of volume on Nov. 13, the most for any day since Aug. 21.
That matters. Weekend markets are thinner, with traditional desks offline and ETFs closed. When volume swells on a Saturday, it usually means motivated sellers are meeting buyers willing to absorb coins at lower prices.
We believe that is the healthier reading. Every coin sold on Saturday was bought by someone who chose to hold Bitcoin at $65,000 rather than wait.
What Happened the Last Time Bitcoin Was This Low?
August offers a useful comparison. Bitcoin hit an intraday low of $62,468.21 on Aug. 14 and closed at $62,836.66 on Aug. 16.
The heavy volume came next. Coinbase logged 16,918 BTC on Aug. 19, 16,155 BTC on Aug. 20 and 20,245 BTC on Aug. 21. Over those three days, Bitcoin’s close jumped from $64,484.18 on Aug. 17 to $78,325.54.
The rally kept going. Bitcoin closed at $86,594.94 on Sept. 21, roughly 38% above its Aug. 16 close.
To be clear, history does not guarantee a repeat. In August, the volume spike came during the rebound, while this one is arriving during the decline. Heavy selling volume can mark a turning point, but it can also come before further weakness.
Still, it shows how quickly sentiment can flip once sellers run out of coins at a given level.
The Long-Term Floor Is Being Tested
Saturday’s drop also took Bitcoin back under an important long-term marker. As we explained in our look at Bitcoin’s 200 week moving average, our calculation put the line at $67,754 at the Nov. 8 weekly close.
At $65,863, Bitcoin sits about 2.8% below that level. A move back above it would need a gain of roughly 2.9%.
This year, Bitcoin posted three weekly closes under the average, on June 28, Aug. 2 and Aug. 16. Each time, it closed back above the line the following week.
The weekly close that counts comes on Sunday at midnight UTC. We would watch that print closely.
Spot Bitcoin ETFs have been a drag. Farside Investors data shows net outflows on seven straight trading days from Nov. 5 to Nov. 13, totaling about $1.91 billion. Friday’s $185.4 million outflow, however, was smaller than the $284.1 million recorded on Thursday.
Can Bitcoin Reclaim $70,000?
From Saturday’s 18:00 UTC price, a return to $70,000 would need a gain of about 6.3%. Bitcoin covered that distance in a single day during the Aug. 19 rebound.
Our checklist for the coming days is short:
- Sunday’s weekly close relative to the 200 week average near $67,750.
- Whether Monday’s ETF flows show the outflows continuing to shrink.
- Whether high volume persists as prices stabilize, which would point to absorption rather than panic.
- The $64,978 low, which now serves as the first level buyers need to defend.
We also see a bigger picture. As our cycle drawdown comparison showed, this decline remains far shallower than the 75%-plus losses of earlier cycles.
We believe the fundamentals have not changed this weekend. Bitcoin’s supply is still capped at 21 million, institutional infrastructure keeps growing, and long-term holders have historically been rewarded for buying fear rather than selling it.
The coming days will show whether this unusually busy Saturday becomes another August-style turning point. If Bitcoin can reclaim its 200 week average, the sell-off may start to look more like a reset than a breakdown.
DC Forecasts is a leader in many crypto news categories, striving for the highest journalistic standards and abiding by a strict set of editorial policies. If you are interested to offer your expertise or contribute to our news website, feel free to contact us at [email protected]












Discussion about this post