



This Bitcoin cycle is now 403 days past its peak, and the comparison with history is more encouraging than the headlines suggest. Bitcoin closed at $68,370 on Coinbase on Nov. 13, about 45.2% below its Oct. 6, 2025 closing high of $124,720.
That is a painful drop for anyone who bought near the top. But at the same point after the 2017 and 2021 peaks, Bitcoin was down 81.9% and 75.4% respectively.
We pulled every daily close from the Coinbase Exchange public data feed since July 2015 to line the three cycles up day by day. The pattern is hard to ignore: each major drawdown has been shallower than the last.
How This Bitcoin Cycle Compares at Day 403
Measuring from closing highs keeps the comparison simple and avoids intraday spikes. The 2017 cycle peaked at $19,650 on Dec. 16, 2017. The 2021 cycle peaked at $67,555 on Nov. 8, 2021.
Exactly 403 days after those peaks, Bitcoin traded at $3,553 in January 2019 and $16,633 in December 2022. Both were deep in what most investors remember as brutal bear markets.
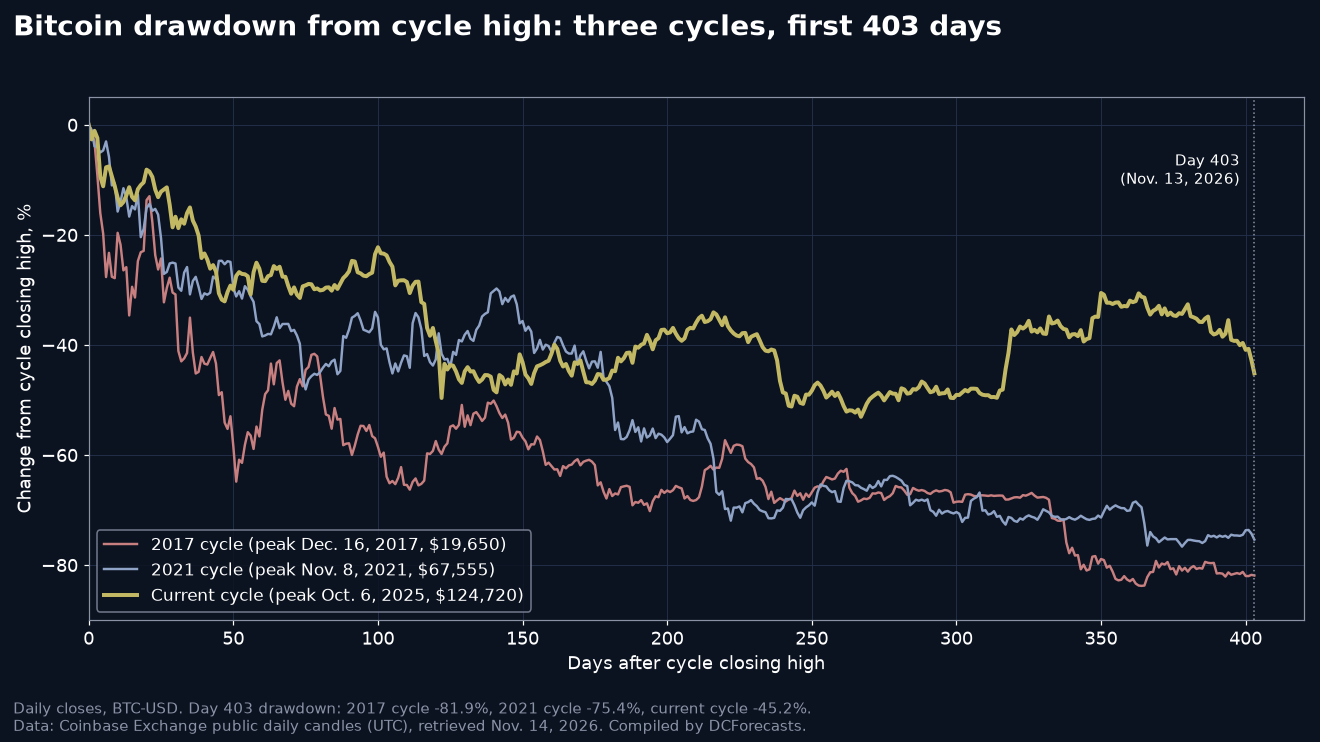
The current cycle has tracked a very different path. It was down about 27% after three months and roughly 45% by mid-February. It then spent most of the next seven months between about 38% and 53% below the peak, before rallying to within about 31% of the high on Sept. 21.
The latest slide has pulled it back to 45%, but the gold line still sits roughly 30 percentage points above where the last two cycles were at the same stage.
The Bitcoin Bottom So Far Was Far Shallower
The deepest close of this cycle came on June 30, 2026, at $58,524. That was 53.1% below the peak, reached 267 days after the top.
In the previous two cycles, the lows came later and cut much deeper. Bitcoin fell 83.8% to $3,183 by Dec. 15, 2018, and 76.7% to $15,760 by Nov. 21, 2022. Each of those lows arrived about a year after the peak.

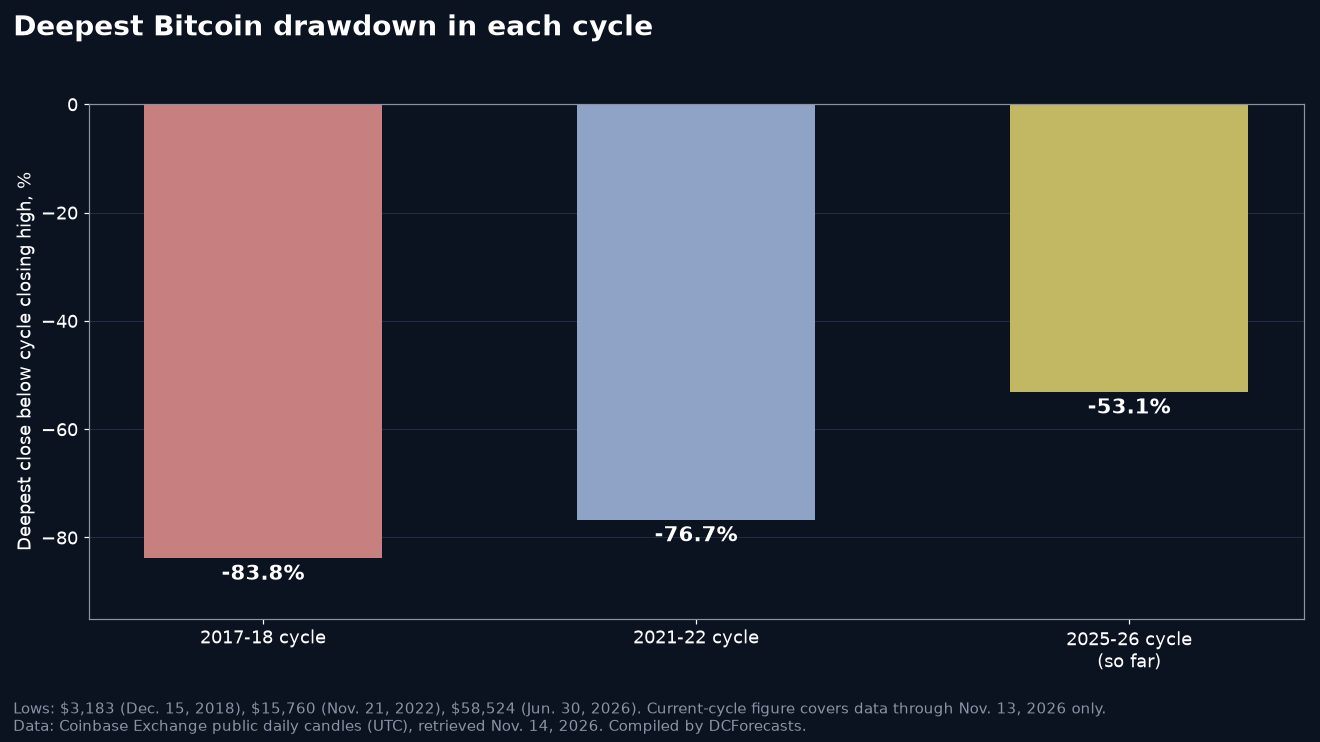
We want to be clear about one thing. The June low is only the low so far. Nothing in the data guarantees it will hold, and Bitcoin is currently trading about 17% above it, not far enough to rule out a retest.
Still, a peak-to-trough decline of about 53% would be the mildest of the three cycles in our dataset by a wide margin.
The math of recovery shows why that matters. From $68,370, Bitcoin would need a gain of about 82% to revisit its $124,720 closing high. From the 2018 low, it needed roughly 517% to regain the 2017 peak, and from the 2022 low about 329% to regain the 2021 peak.
A shallower hole is simply easier to climb out of, and in both earlier cycles Bitcoin did eventually climb all the way out.
Why Bitcoin Bear Market Drawdowns Keep Shrinking
We see three structural reasons behind the shallower swings, and each is visible in public data.
- A bigger, deeper market. At $124,720 per coin, the October 2025 peak valued Bitcoin at well over $2 trillion. Moving an asset that large takes far more capital than it did in 2017, when the peak was below $20,000.
- Regulated access. U.S. spot Bitcoin ETFs, approved by the Securities and Exchange Commission in January 2024, did not exist in either previous bear market. They give pensions, advisers and banks a familiar way to buy weakness.
- Corporate and long-term holders. Treasury companies and patient investors now hold large amounts of supply off exchanges, which tends to thin out forced selling during declines.
None of these factors removes volatility. A 45% drop is still a serious drawdown. But they help explain why the floor has kept rising.
What the Bitcoin 4 Year Cycle Says About Recovery
Recoveries have also arrived faster. After the December 2018 low, Bitcoin needed 716 days to close above its 2017 high again, finally doing so on Nov. 30, 2020.
After the November 2022 low, it needed 469 days, setting a fresh closing high on March 4, 2024.
We are not projecting a date from two data points, and we would caution anyone who does. Two cycles are too few to build a reliable model, and market conditions in 2026 differ from both earlier periods.
What the record does show is a steady trend: smaller peak-to-trough declines and shorter climbs back to new highs.
Key Levels to Watch From Here
The nearest reference point sits just below the current price. Our Nov. 12 analysis put the 200-week moving average at a record $67,754, a level long-term buyers have historically defended.
Below that, the June 30 close at $58,524 marks this cycle’s floor so far. Above, the September recovery high at $86,595 shows how quickly sentiment can turn once buyers return. We also looked at the shorter-term picture in our piece on the short-term holder cost basis.
Our view is constructive. Bitcoin is in a meaningful pullback, but it is doing so from a far higher base and with a far shallower drawdown than at this stage of any prior cycle in the Coinbase record.
For long-term holders, the more useful question is not how far Bitcoin has fallen this month. It is how much higher each cycle’s floor has been than the one before.
DC Forecasts is a leader in many crypto news categories, striving for the highest journalistic standards and abiding by a strict set of editorial policies. If you are interested to offer your expertise or contribute to our news website, feel free to contact us at [email protected]












Discussion about this post