



A bitcoin death cross is back on the radar. After last week’s slide, bitcoin’s 50-day moving average has turned lower and is closing in on its 200-day average, the pairing that chart watchers use to call golden crosses and death crosses.
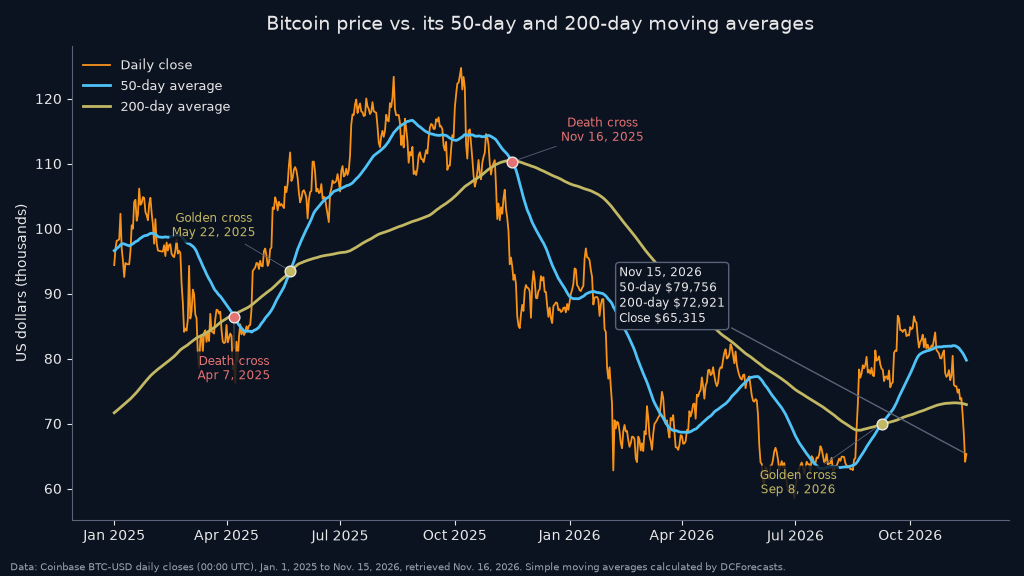
The two lines are not touching yet. At Sunday’s close, the 50-day average stood at $79,756, still 9.4% above the 200-day at $72,921.
But the gap is shrinking fast. If bitcoin simply held Sunday’s close of $65,315 every day from here, our calculations show the 50-day would slip under the 200-day on Dec. 9.
So we went back through every death cross since 2018 to see what the signal has actually meant for bitcoin. The answer is less frightening than the name.
How Close Is the Next Bitcoin Death Cross?
We used Coinbase BTC-USD daily closes, measured at midnight UTC, and calculated simple 50-day and 200-day moving averages through Sunday, Nov. 15.
The current golden cross dates to Sept. 8, when the 50-day climbed above the 200-day with bitcoin closing at $78,447. That ended a death cross that had been in place since Nov. 16, 2025.
The 50-day average peaked at $81,990 on Nov. 4. Since then, it has dropped about $2,200 as higher September and October prices roll out of the window.
The spread between the averages tells the story. It was 12.3% on Oct. 16, 11.7% on Nov. 8 and 9.4% on Nov. 15.
Why the 50-Day Is Falling Faster
The math is simple. A 50-day average drops quickly when today’s price sits far below the prices it replaces, and right now bitcoin is 18.1% below its 50-day.

The 200-day moves far more slowly. Bitcoin closed below it on Nov. 12, its first close under the 200-day since Aug. 18, and now trades 10.4% under it.
Price would need to rally strongly, and soon, to stop the crossover. A rebound back toward the high-$70,000s within the next few weeks would slow the 50-day’s decline sharply.
That is why the Dec. 9 date is an estimate, not a forecast. It assumes a perfectly flat price, which bitcoin almost never delivers.
Nine Death Crosses Since 2018, and a Mixed Record
In the Coinbase data, the 50-day has fallen below the 200-day nine times since March 2018. We measured bitcoin’s price 90 and 180 days after each one.
The results split almost evenly. Bitcoin was higher 90 days later in five of the nine cases, and also higher after 180 days in five cases.
The median move 90 days after a death cross was a gain of 25.7%. After 180 days, the median gain was 34.2%.
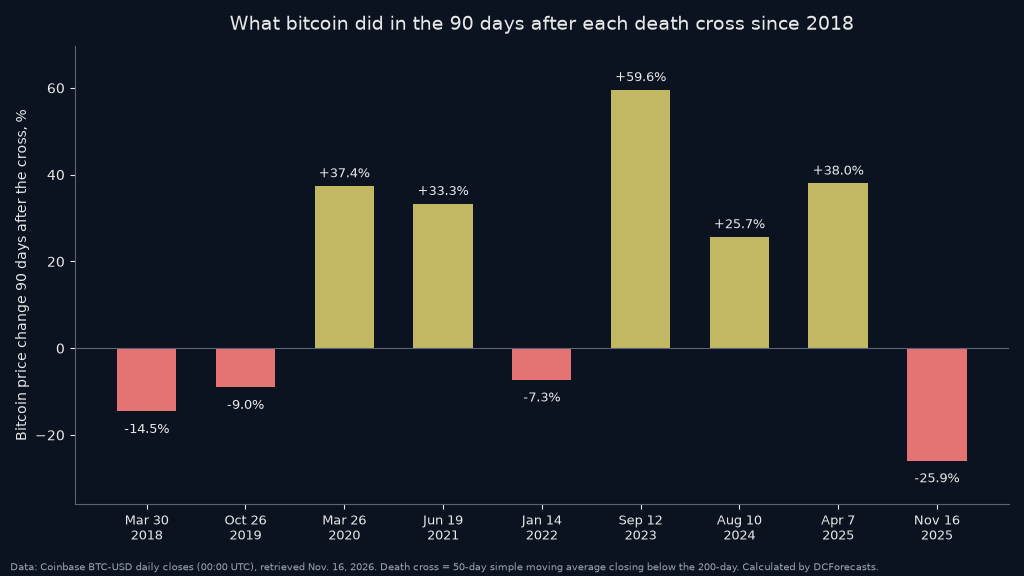
The best example is September 2023. Bitcoin closed at $25,841 on the day of that death cross, never closed lower over the next 90 days, and was up 59.6% three months later.
The August 2024 cross, at $60,935, was followed by a 25.7% gain in 90 days. The April 2025 cross, at $79,140, came within days of a local low and preceded a 38% gain.
When the Death Cross Did Hurt
The losing cases deserve equal weight. In January 2022, bitcoin was 7.3% lower after 90 days and 53.1% lower after 180 days as that bear market deepened.
The most recent example was also painful. After the Nov. 16, 2025 death cross at $94,184, bitcoin was 25.9% lower 90 days later and still 16.1% lower after 180 days.
The 2018 and 2019 crosses were followed by 90-day declines of 14.5% and 9%.
In other words, the signal has not been a reliable sell trigger in either direction. Because it is built from past prices, it often confirms a drop that has already happened.
What This Means for Bitcoin Now
We believe the setup today looks more like a late signal than a fresh warning. Bitcoin has already fallen about 48% from its record close of $124,720 on Oct. 6, 2025, and the averages are still catching up.
That matters because several past crosses arrived near the end of sell-offs rather than the start. The 2020, 2023, 2024 and April 2025 crosses all landed within weeks of meaningful lows.
The longer-term trend line also offers context. We recently noted that bitcoin’s 200-week moving average has kept rising, a sign that the multi-year uptrend remains intact even as short-term averages roll over.
The five-week losing streak that preceded this move had only two precedents since 2015, which also points to how stretched the selling has become.
What to Watch Into December
The first marker is the 50-day itself. Each day bitcoin closes well below about $80,000, the average keeps sliding toward the 200-day.
The second is the 200-day near $72,900. A close back above it would be the clearest sign that buyers have regained control, and it would likely push any crossover further out.
Until then, we treat a possible bitcoin death cross as a description of the last two months, not a verdict on the next six. History shows that bitcoin has often done its best work after the headlines turn darkest.
DC Forecasts is a leader in many crypto news categories, striving for the highest journalistic standards and abiding by a strict set of editorial policies. If you are interested to offer your expertise or contribute to our news website, feel free to contact us at [email protected]












Discussion about this post