



Buyers came back for the Bitcoin dip on Tuesday. On Binance’s spot BTC/USDT market, traders who hit the ask bought $186 million more Bitcoin than traders who hit the bid sold on Nov. 17.
That was the largest daily net buy since Oct. 27. It came straight after the heaviest three-day stretch of aggressive selling in this downturn.
The wider picture is just as notable. Since Oct. 6, the price is down 24.3%, yet aggressive buyers have still outbought aggressive sellers by $601 million.
What taker flow measures
Every trade on an order book has two sides. A maker posts a resting order and waits, while a taker crosses the spread to trade right away.
When a taker buys, it signals urgency to own Bitcoin. When a taker sells, it signals urgency to get out. Binance’s public market data splits each day’s volume into taker buys and taker sells, so we can measure which side was in a hurry.
We call the difference, in dollars, net taker buying. A positive number means aggressive buyers outweighed aggressive sellers that day.
Three days of forced-looking selling, then a reversal
From Nov. 13 to Nov. 15, net taker flow was negative every day, adding up to $396 million of net selling. The taker buy share of volume fell to 48.52%, then 46.39%, then 45.24%.
Activity spiked at the same time. Binance logged 7.48 million BTC/USDT trades on Nov. 14 and 7.40 million on Nov. 15, about double its 2026 average of 3.57 million a day through October.
Dollar volume told the same story. The three days traded a combined $6.09 billion, or about $2.03 billion a day, compared with a 2026 average of $1.31 billion a day through October.

The price moves were large, too. Bitcoin fell 4.4% on Nov. 13 and 6.1% on Nov. 14, then bounced 1.87% on Nov. 15 even while sellers were still the more aggressive side.
That pattern looks like a flush. Heavy trade counts with sellers in a rush usually mean stop-losses and forced exits, not calm portfolio changes.
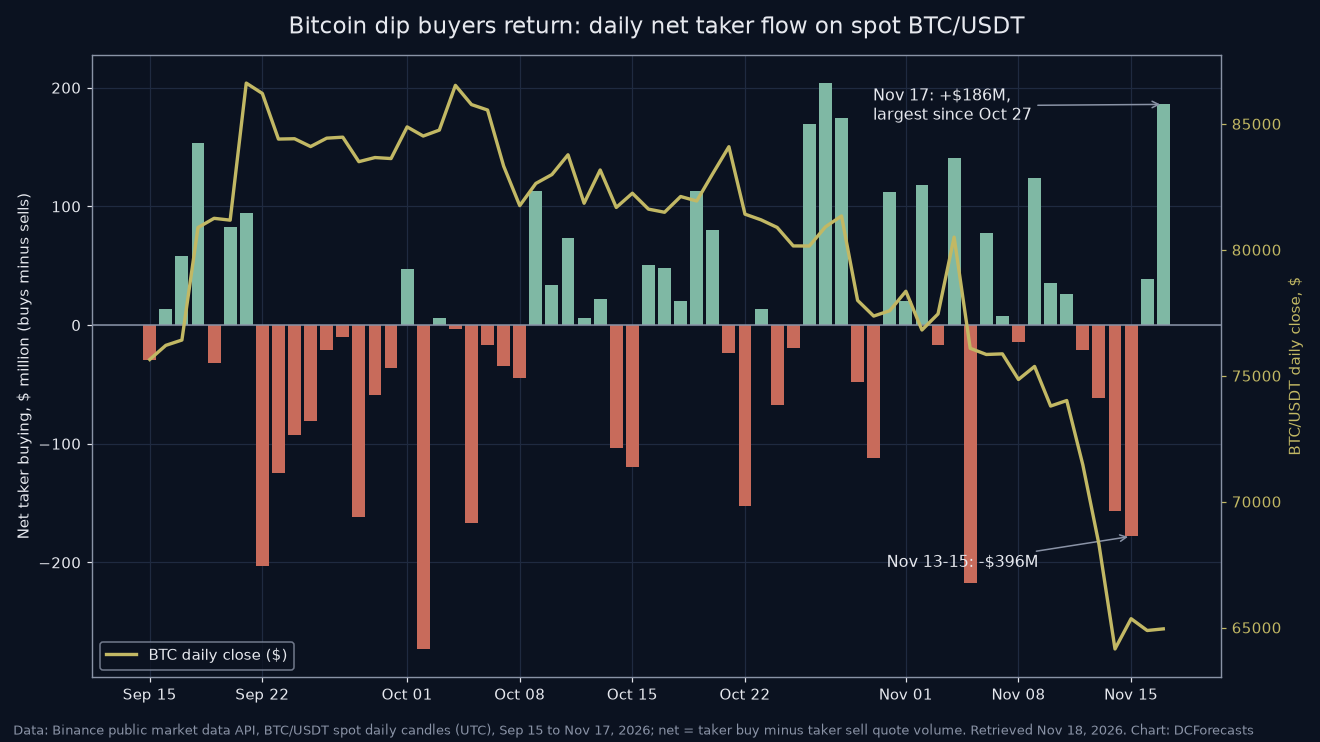
Then the tone flipped. Net flow turned positive at $39 million on Nov. 16 and jumped to $186 million on Nov. 17, when the taker buy share reached 55.09%.
The average taker buy share across 2026 has been 49.69%. A reading above 55% has shown up on only nine other days since Oct. 1.
The price held steady through the shift. Bitcoin closed at $64,947 on Nov. 17, little changed from $64,883 a day earlier, after dropping as low as $63,336 during the session.
A 24% slide with more buyers than sellers
Stretch the lens to Oct. 6 and the data tell a story the price chart hides. Over those 43 days, takers bought 348,296 BTC on this market and sold 341,102 BTC.
Net buying was positive on 25 of the 43 days, and the running total reached $773 million by Nov. 12. Even after the Nov. 13 to Nov. 15 flush, it stood at $601 million on Nov. 17.
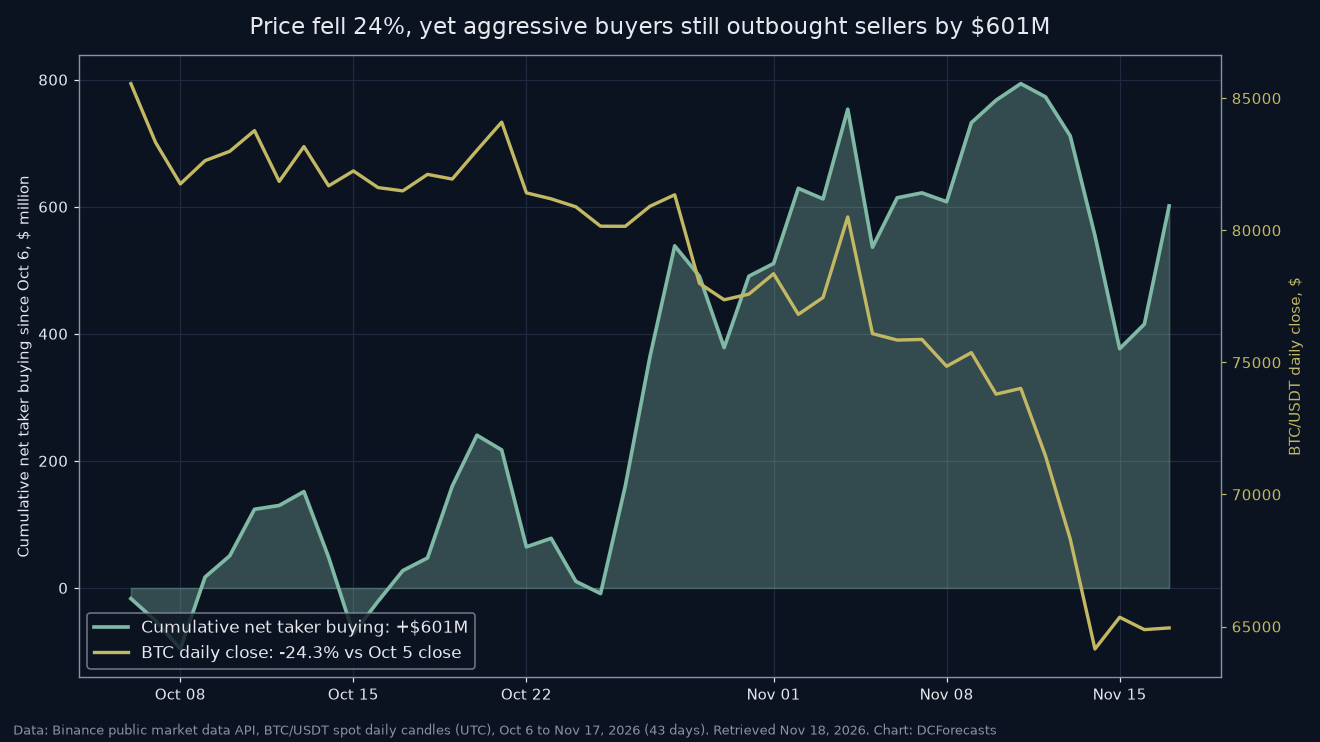
So why did the price fall? Taker flow covers one venue and one pair. Selling in futures, on other exchanges and through ETF redemptions all moved the price, too.
Large passive sellers can also lower their asks again and again, and those orders count as maker volume. Aggressive buyers can lift every offer and still watch the price slide if the offers keep coming lower.
Still, the steady net buying suggests that spot demand never disappeared. Buyers kept stepping in, just at lower prices.
How this fits other signals
The taker data lines up with other recent readings. Earlier this month, we tracked falling selling pressure as buyers accumulated, and sentiment hit a Fear and Greed reading of 10, the kind of extreme that has often come near lows.
Our session-by-session study also found that much of the decline came in thinner trading hours. Taken together, the evidence points to supply getting absorbed rather than demand drying up.
Is the Bitcoin dip over?
One strong day does not make a bottom, and taker flow on a single venue is only one piece of the demand picture. Net taker buying has turned positive many times during this slide, and the price has kept falling.
We would want to see two things next. First, a run of positive days rather than one. Second, the price rising alongside the flow on daily closes, which would show buyers are no longer being met by endless lower offers.
If both show up, Tuesday’s $186 million may look like the moment the balance tipped. If not, the buyers of the past six weeks have still built positions at prices well below the $87,000 area seen in September, a base that tends to support the next recovery.
DC Forecasts is a leader in many crypto news categories, striving for the highest journalistic standards and abiding by a strict set of editorial policies. If you are interested to offer your expertise or contribute to our news website, feel free to contact us at [email protected]












Discussion about this post