


Is Bitcoin a good investment when the price sits 48% below its record and anyone who bought a year ago is down about 30%?
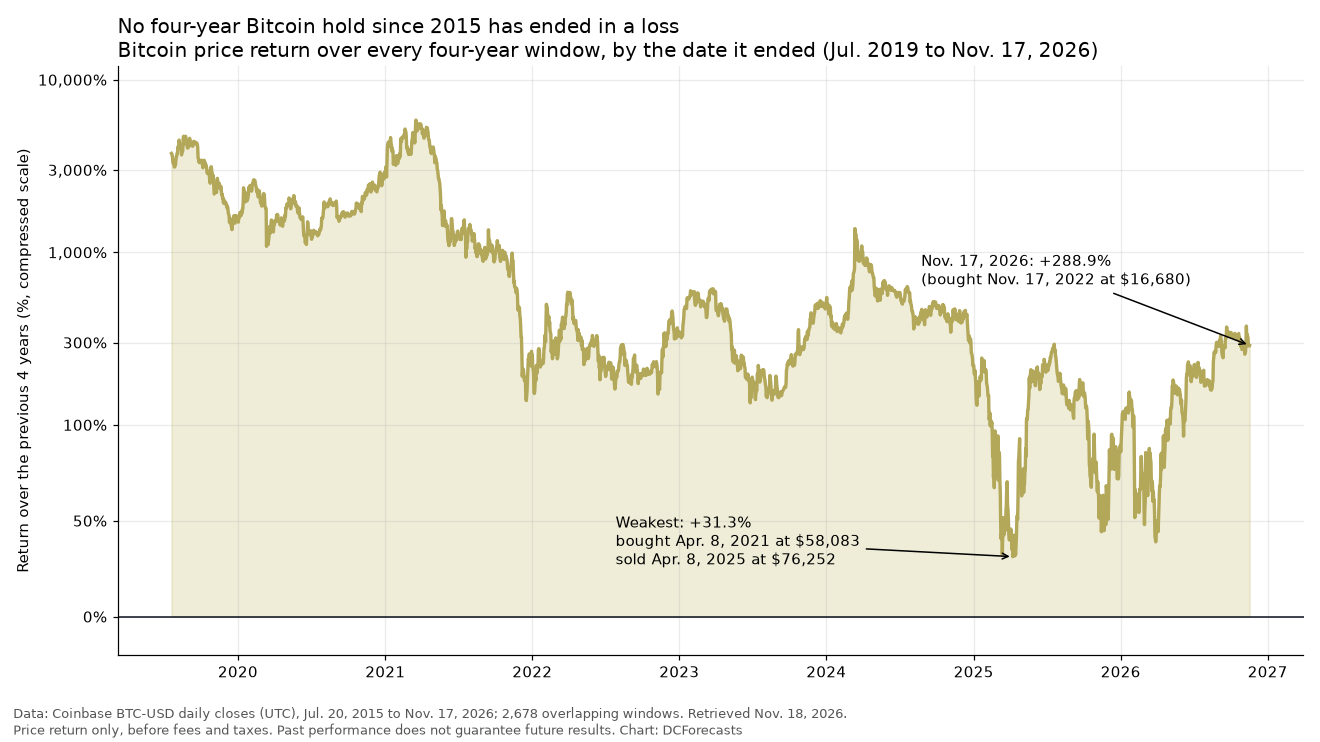
Eleven years of daily prices give a surprisingly clear long-run answer. Every one of the 2,678 four-year holding periods that began between July 20, 2015, and Nov. 17, 2022, ended with a gain.
The weakest of them still returned 31.3%. The median four-year return was 409%.
For Bitcoin investors, the most useful finding is how fast the odds improved with time. One-year holds lost money almost three times in ten.
The bigger question now is how today’s drawdown looks when it is measured in years rather than weeks.
How We Measured Every Bitcoin Holding Period
We used Coinbase BTC-USD daily closing prices (UTC) from July 20, 2015, to Nov. 17, 2026. That is 4,139 consecutive days with no gaps.
For each day, we compared the close with the close on the same calendar date one, two, three, four and five years later.
These are price returns only. They ignore trading fees, taxes and custody costs, which would trim every result.
The windows also overlap heavily. Two start dates a day apart share almost the same path, so 2,678 four-year results are not 2,678 independent tests, and the data spans fewer than three full market cycles.

Why Short-Term Bitcoin Returns Look So Different
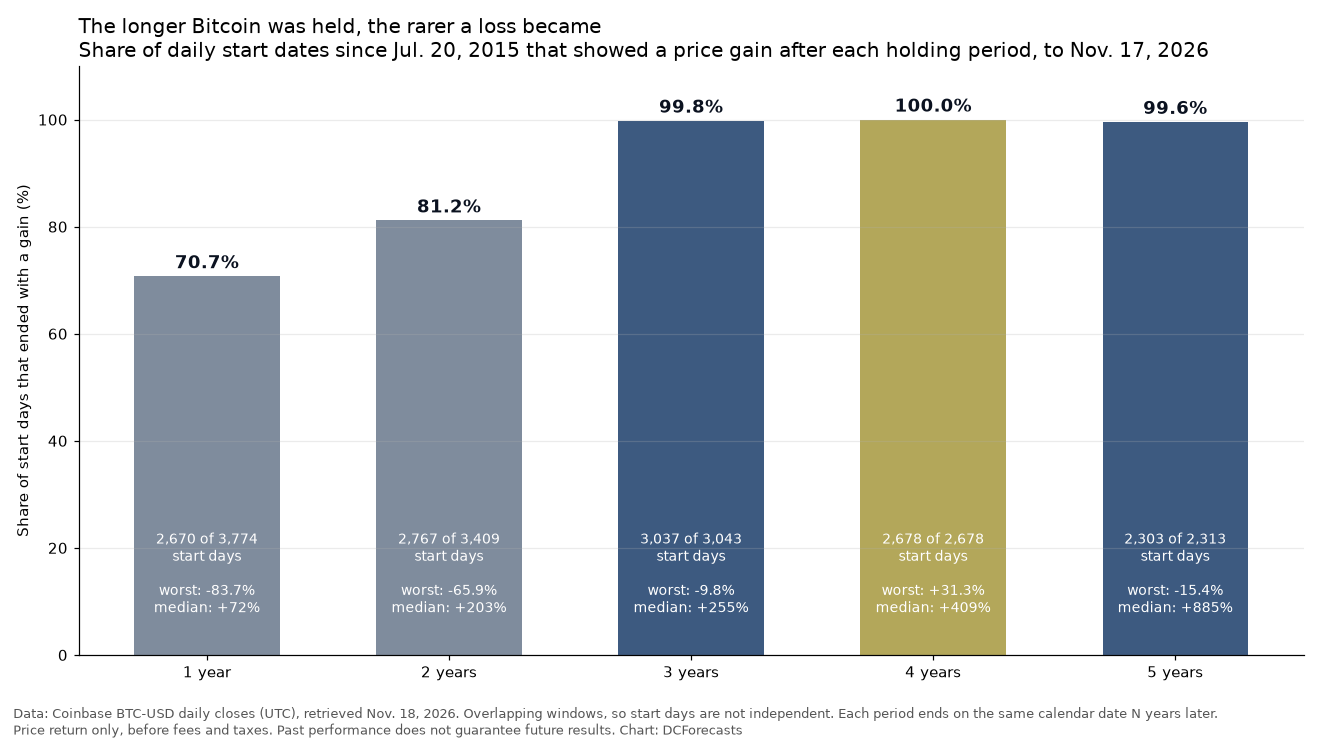
Over one year, 2,670 of 3,774 start days ended higher, a 70.7% hit rate. The median one-year gain was 72%.
The downside was severe, though. Buying at the December 2017 peak, at $19,650 on Dec. 16, meant an 83.7% loss a year later.
Two-year holds were positive 81.2% of the time, with a worst result of minus 65.9% from that same December 2017 top.
At three years, the picture changes sharply. Only six of 3,043 start days lost money, all between Feb. 8 and Feb. 22, 2021, during the early-2021 rally.
The worst three-year result was minus 9.8%, from $57,489 on Feb. 21, 2021, to $51,852 on Feb. 21, 2024.
Five-year holds were positive 99.6% of the time. Nine of the 10 losing start days clustered around the 2017-2018 top.
The tenth is recent. A buyer on Nov. 14, 2021, at $65,505 was down 2.1% exactly five years later, a gap we explored in our five-year look at Bitcoin against Ether and other altcoins.
That matters for honesty. Long holds have usually rescued badly timed entries, but not in every single case.
Where Bitcoin Holders Stand on Nov. 17
Bitcoin closed at $64,873 on Coinbase on Nov. 17. That is 48.0% below the record close of $124,720 set on Oct. 6, 2025.
- One year: down 29.6% from $92,101.
- Two years: down 27.8% from $89,887.
- Three years: up 77.3% from $36,595.
- Four years: up 288.9% from $16,680.
- Five years: up 7.5% from $60,352.
The split is striking. Recent buyers are underwater, while anyone who bought near the 2022 low has nearly quadrupled their money.
This lines up with the long-term trend signals we tracked when Bitcoin slipped below its 200-week average, a line it has reclaimed after every break since 2019.
Why the Bitcoin 4 Year Cycle Shows Up in the Data
Four years is not an arbitrary choice. Bitcoin’s block subsidy halves every 210,000 blocks, which has worked out to roughly every four years.
Halvings took place in July 2016, May 2020 and April 2024, and the next is on track for around April 2028.
Every four-year window in the study therefore contained at least one halving and, in most cases, a full boom and bust.
That is our interpretation, not a law of nature. But it fits the evidence: the weakest four-year result came from buying near the April 2021 high, at $58,083 on April 8, and selling during a sharp dip four years later, at $76,252.
Even that unlucky pairing produced a 31.3% gain. We believe that is what Bitcoin historical returns really show: timing mattered enormously over months and much less over a full cycle.
What Would It Take to Break the Four-Year Record?
The four-year windows that close over the next 12 months began between Nov. 18, 2022, and Nov. 17, 2023.
The highest close in that stretch was $37,885 on Nov. 15, 2023. Bitcoin’s Nov. 17 close is 71.2% above it.
In other words, Bitcoin would have to fall 41.6% from here, and stay there on the relevant anniversary, before any of those windows ended in a loss.
That is arithmetic, not a forecast. History offers no guarantee, and Bitcoin returns can still be deeply negative over months, as this year has shown.
Investors using leverage, or who might need to sell within a year, face a very different risk profile than the patient holder in our data.
Patience Has Been Bitcoin’s Most Reliable Edge
The short-term numbers are uncomfortable, and we do not hide from them. A 48% drawdown hurts, and so does a 30% one-year loss.
Yet the long-term record points the other way. A fixed 21 million coin supply, a predictable issuance schedule and a growing base of regulated ETFs and institutional custodians give Bitcoin a structure that rewards time in the market.
For us, the key takeaway is simple: in Bitcoin’s history, the holding period has mattered more than the entry price.
The coming months will test how strong that pattern is. If the four-year record holds again, today’s discount may look very different to buyers in 2030.
DC Forecasts is a leader in many crypto news categories, striving for the highest journalistic standards and abiding by a strict set of editorial policies. If you are interested to offer your expertise or contribute to our news website, feel free to contact us at [email protected]












Discussion about this post