



The gold price drop deepened on Wednesday, pulling bullion to its lowest level in 14 months.
COMEX gold futures traded near $3,772 an ounce in the European morning, down about 2.4% from Tuesday’s close of $3,864. The session low of $3,759.90 was the weakest print since Sept. 25, 2025.
That leaves gold roughly 29% below its record close of $5,318 on Jan. 29, a peak that now looks like a different market.
For Bitcoin investors, the comparison is worth a closer look. Since late February, Bitcoin has gone essentially nowhere, while gold has lost more than a quarter of its value.
The bigger question is what is driving the metal lower, and whether the same force is still weighing on BTC.
How Deep Is the Gold Price Drop?
The numbers are stark for an asset sold as a store of calm.
Gold futures closed 2025 at $4,341.10. At Wednesday’s level, the metal is down about 13.1% for the year and 29.1% from the January record.
The intraday record from that Jan. 29 session was $5,586.20. Measured from there, the slide is closer to 32%.
Silver has fared far worse. Futures traded near $45.67 on Wednesday, about 60% below their Jan. 26 record close of $115.08 and at their lowest since early October 2025.

The largest gold ETF tells the same story. SPDR Gold Shares (GLD) closed at $352.48 on Tuesday, its lowest close since Sept. 29, 2025, and 28.9% below its Jan. 29 close of $495.90.
None of this was a single bad day. Gold has fallen in waves since February, with sharp relief rallies in April, August and early November that each failed to hold.
Why Is Gold Dropping? Follow Real Yields
The clearest pressure point is the return investors can earn on inflation-protected government debt.
Gold pays no interest. When real yields rise, holding it costs more in income given up, and that has historically weighed on the price.
According to U.S. Treasury daily real yield curve data, the 10-year TIPS real yield stood at 2.89% on Nov. 17, up a full percentage point from 1.89% on Jan. 29, the day gold peaked.
It touched 2.95% on Oct. 5, its high for the year, after bottoming at 1.72% on Feb. 27.
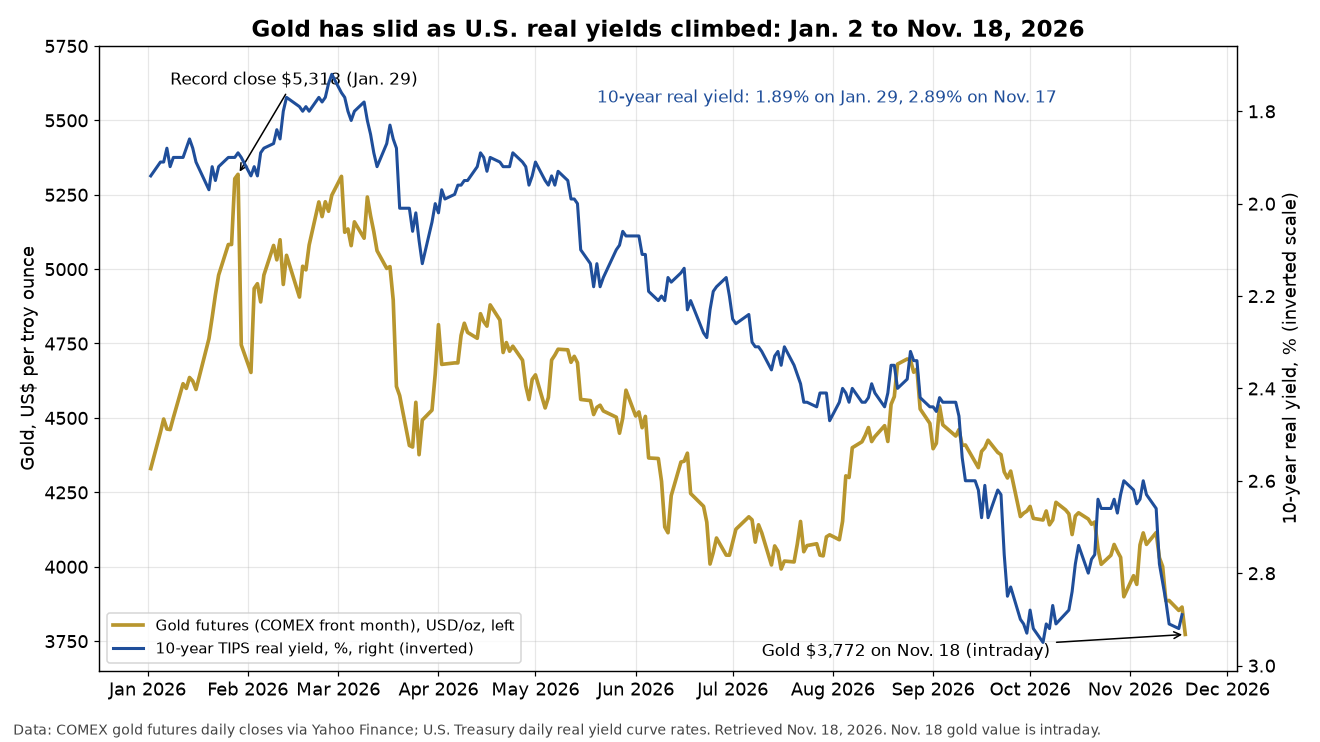
The nominal 10-year Treasury yield sits at 5.10%, versus 4.24% on Jan. 29. As we noted when the 10-year yield climbed back above 5%, that level has been a headwind for every asset that does not pay a coupon.
The dollar has added to the squeeze. The ICE U.S. Dollar Index traded near 103.8 on Wednesday, about 7.8% above its Jan. 29 level of 96.28. A stronger dollar makes gold more expensive for buyers holding other currencies.
We would treat those links as the main evidence rather than a full explanation. Positioning and profit-taking after January’s spike likely played a part too, but the rate and dollar data are the parts we can measure.
Gold vs Bitcoin Since February
This is where the picture turns more interesting for Bitcoin holders.
On Feb. 23, gold futures closed at $5,225.60 and Bitcoin at $64,617. On Wednesday morning, Bitcoin traded near $64,648. Gold, over the same stretch, fell about 27.8%.
Put another way, one Bitcoin bought about 12.4 ounces of gold on Feb. 23, the lowest reading since March 2023. Today it buys about 17.1 ounces, a rise of roughly 39%.
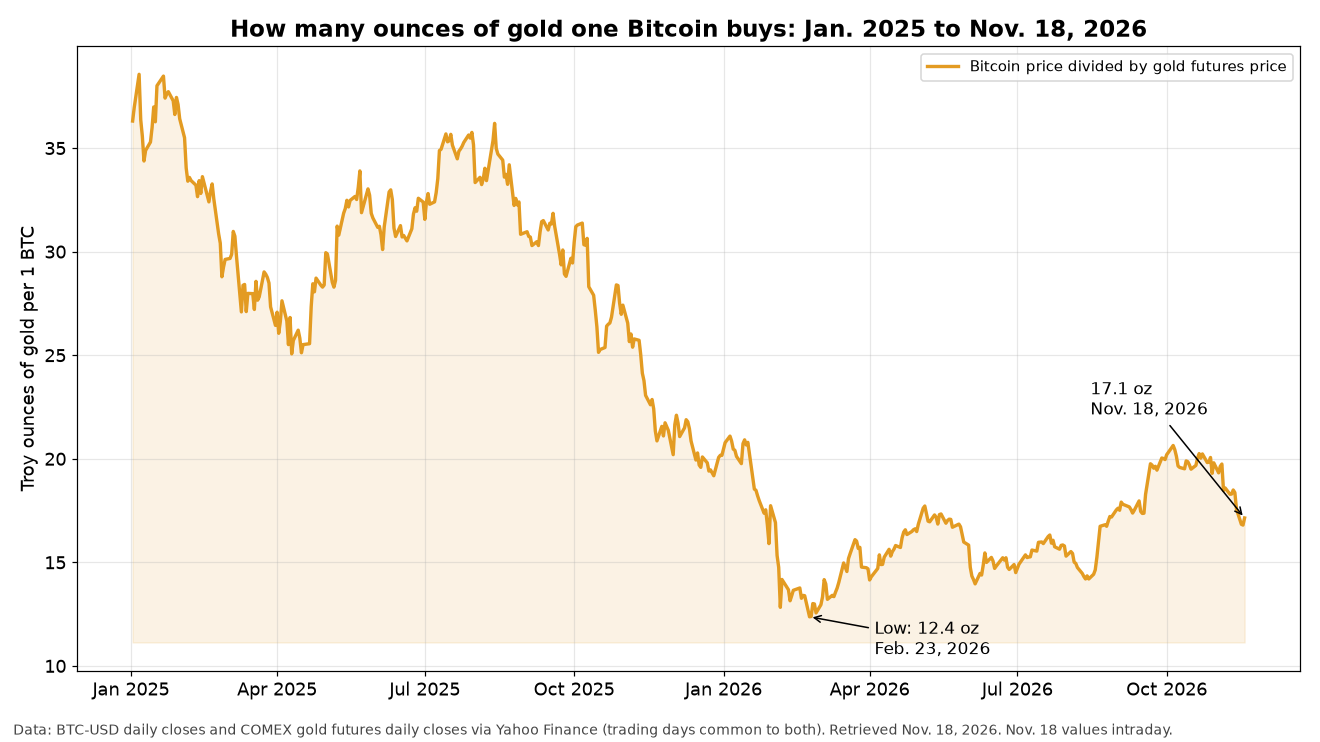
We should be clear about the full record. Bitcoin is down about 26% this year, worse than gold’s 13% decline, and it remains roughly 48% below its October 2025 record close near $124,753.
The ratio also peaked at 20.6 ounces on Oct. 5 and has eased since, as Bitcoin’s own November selloff took hold.
Even so, the eight-month trend matters. We believe it shows Bitcoin absorbing the same high-rate pressure that has crushed precious metals, without making a new low against gold.
What the Silver Price Crash Adds
Silver’s 60% fall is a reminder that “hard asset” does not mean low risk.
Silver ran far harder than gold in January and has given back far more since. Both metals now sit near levels last seen in autumn 2025, before the parabolic run began.
For us, the takeaway is about crowded trades. Assets that attract a rush of momentum buyers tend to unwind sharply when the macro backdrop turns.
Bitcoin went through its own version of that after October 2025. As we covered, it recently slipped under its 200-week average, a line it has reclaimed after every break since 2019.
What Could Turn the Tide for Gold and Bitcoin?
The common thread is real yields. If they ease from near 2.9%, both gold and Bitcoin would lose one of their biggest headwinds at the same time.
We would watch four things in the coming weeks:
- The 10-year TIPS yield and whether it breaks above its 2.95% October high.
- The Dollar Index, now near 103.8, and whether it can push higher.
- Gold’s $3,751.90 low from Sept. 25, 2025, the next reference point below Wednesday’s trade.
- Bitcoin’s ratio to gold, and whether it can hold above the 12.4-ounce February low.
Gold’s long record as a reserve asset is not in question. But this year has shown that it can lose almost a third of its value when money gets more expensive.
Bitcoin’s case rests on something gold cannot match: a hard cap of 21 million coins, verifiable by anyone, with growing institutional rails behind it.
The coming weeks will show whether high real yields keep pressing down on both assets. If they finally ease, investors may find that Bitcoin held its ground against gold through one of the metal’s worst stretches in years.
DC Forecasts is a leader in many crypto news categories, striving for the highest journalistic standards and abiding by a strict set of editorial policies. If you are interested to offer your expertise or contribute to our news website, feel free to contact us at [email protected]












Discussion about this post