



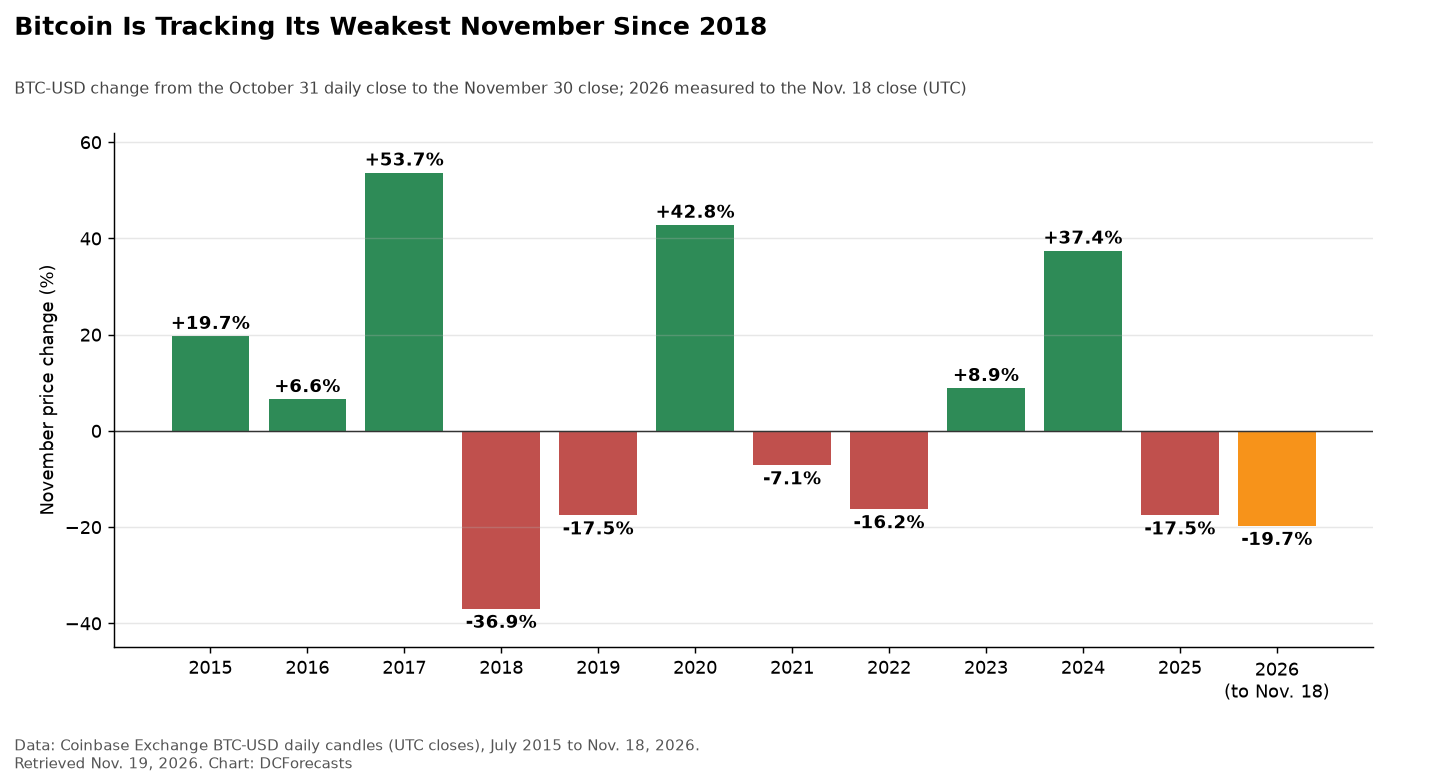
The bitcoin cycle has just handed holders one of its roughest Novembers on record. Bitcoin closed Nov. 18 at $62,175.62 on Coinbase, down 19.7% from its Oct. 31 close of $77,423.98.
With 12 days still to go, that already makes this the weakest November since 2018. It also arrives 408 days after the Oct. 6, 2025 peak close of $124,720, almost exactly the distance at which the last two bear markets found their floors.
We pulled every daily close in Coinbase’s BTC-USD history back to July 2015 to see what weak Novembers have meant before. The answer is more nuanced than either bulls or bears tend to admit.
How Bad Is This November?
From 2015 through 2025, Bitcoin’s November return averaged a gain of 6.7%. Six of those 11 Novembers finished higher, led by a 53.7% surge in 2017 and a 42.8% jump in 2020.
The other five were losses: 2018 (down 36.9%), 2019 (down 17.5%), 2021 (down 7.1%), 2022 (down 16.2%) and 2025 (down 17.5%).
This year’s 19.7% month-to-date drop is deeper than every one of those except 2018. It also follows a 7.3% loss in October, so Bitcoin has now fallen in back-to-back autumn months for a second straight year.
December Has Not Rescued Weak Novembers
Honesty matters here, so we will start with the uncomfortable number. In all five years when November closed lower, December also closed lower.
Those December losses ranged from 3.2% in 2025 to 18.9% in 2021. A quick year-end rebound has never followed a red November in this data set.
That does not make a red December a rule. Eleven Novembers are a small sample, and calendar months do not move markets on their own. But anyone counting on a seasonal bounce within weeks should know the record does not support it.

Where the Real Turning Points Sat
The longer view is far more encouraging. Two of the five weak Novembers sat right next to the lowest prices of their entire bear markets.
In 2018, Bitcoin bottomed at a daily close of $3,183 on Dec. 15, just 15 days after a 36.9% November collapse. That low came 364 days after the Dec. 16, 2017 peak.
In 2022, the bottom came inside November itself, at $15,760 on Nov. 21. That was 378 days after the Nov. 8, 2021 peak close of $67,555.
Both cycles took roughly a year to find their lows. Today’s cycle is now 408 days past its peak, which places it in the same seasonal and cyclical window where those two bear markets ran out of sellers.
A Much Shallower Bitcoin Cycle Drawdown
The most striking difference is depth. At the Dec. 2018 low, Bitcoin sat 83.8% below its prior peak. At the Nov. 2022 low, it was 76.7% below.
In this cycle, the lowest close so far was $58,523.93 on June 30, 2026, a 53.1% drawdown. Bitcoin then rallied 48% to $86,595 by Sept. 21 before the latest slide. Even after the November sell-off, it sits 50.1% below its peak and about 6% above that June low.
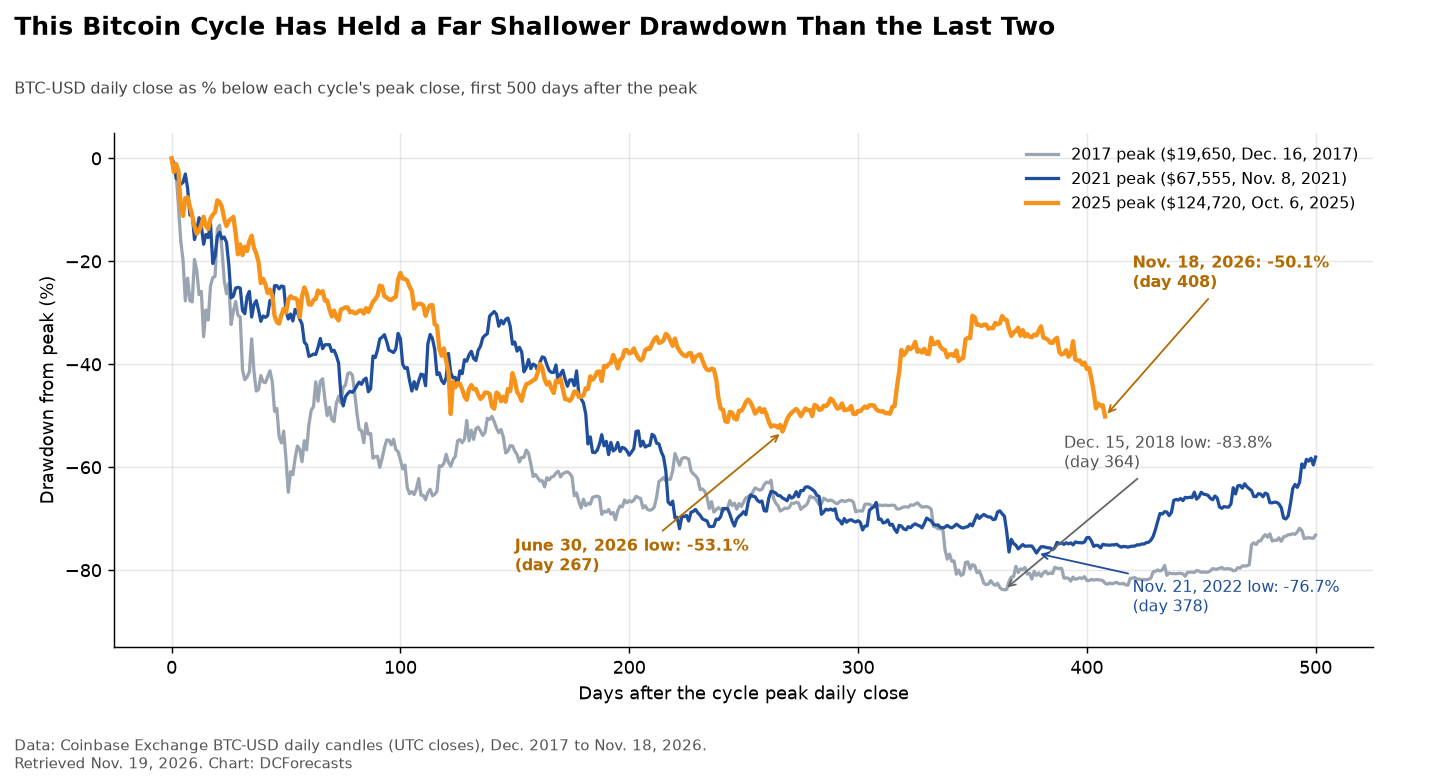
We believe that gap reflects a deeper, more institutional buyer base than in earlier cycles. A market that once shed four-fifths of its value now holds above half, even through a month like this one.
Long-term trend gauges tell a similar story. Our recent look at Bitcoin’s 200-week moving average showed that every break of that line since 2019 was eventually reclaimed.
What Happened 12 Months Later?
Patience has paid most of the time. Measured from each weak November’s Nov. 30 close to the next year’s Nov. 30 close, Bitcoin gained 90.0% after 2018, 160.9% after 2019 and 119.8% after 2022.
The exception was 2021, when November marked the start of the bear market rather than its end, and the following year brought a 69.9% loss. The 2025 case is not complete, but Bitcoin is 31.2% below its Nov. 30, 2025 close with 12 days left.
That makes three gains and one loss among completed periods. The losing case began just weeks after a fresh all-time high, which is a very different position from a market already 13 months into a correction.
Our earlier study of four-year Bitcoin holding periods found the same pattern at a longer horizon: time in the market has repeatedly outweighed painful entry points.
What We Are Watching Next
The June 30 close near $58,524 is the line that matters most. Holding above it would leave this cycle’s low intact and keep the drawdown far shallower than in 2018 or 2022.
The calendar is the second marker. If this cycle rhymes with the last two, the 12-to-13-month window after the peak has historically been where long-term buyers found their best prices.
None of this guarantees a bottom is in. Prices could still test lower levels, and December’s record after weak Novembers is a clear caution against expecting an instant recovery.
But we believe the evidence leans constructive. This November is painful, yet it is landing late in the cycle, from a far shallower drawdown, at a point where past bear markets gave way to the gains that followed.
DC Forecasts is a leader in many crypto news categories, striving for the highest journalistic standards and abiding by a strict set of editorial policies. If you are interested to offer your expertise or contribute to our news website, feel free to contact us at [email protected]












Discussion about this post