



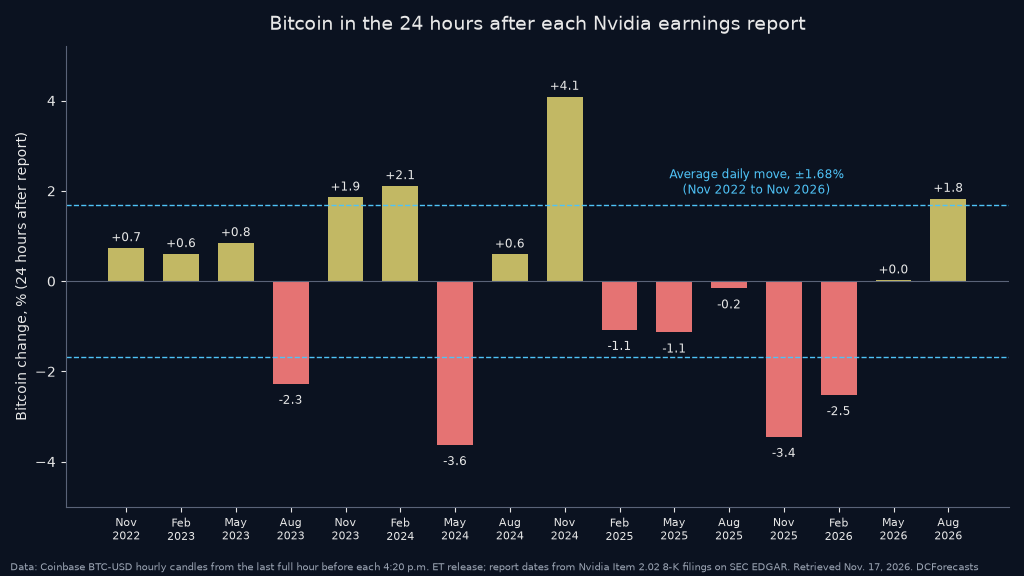
Nvidia reports results for its third quarter of fiscal 2027 after the U.S. stock market closes on Tuesday, Nov. 17, and crypto traders are treating the release as a macro event for bitcoin. The numbers say they may be overestimating it. Across the 16 Nvidia earnings reports since November 2022, bitcoin’s average move in the following 24 hours was 1.68%, the same as its average daily move over those four years.
This quarter carries more than the usual weight. Nvidia’s board accepted the resignation of Jen-Hsun Huang as president, CEO and director on Nov. 11 and named chief financial officer Colette Kress interim CEO while it searches for a successor, according to a Form 8-K filed with the SEC on Nov. 12. Tuesday’s report will be the first under interim leadership, so a sharp reaction in the stock is possible. History suggests that bitcoin, which already sold off with technology shares during the Nvidia probe headlines on Nov. 9, tends to absorb these nights without much drama.
How the Nvidia earnings date study was built
Each release date comes from Nvidia’s own Item 2.02 “Results of Operations” filings in the SEC EDGAR filing index. The 16 reports run from Nov. 16, 2022 to Aug. 26, 2026. Nvidia publishes results at about 4:20 p.m. Eastern time, so the starting price for each event is the Coinbase BTC-USD close of the last full hour before that time. The 24-hour and 72-hour readings use the hourly close at the same time one and three days later. The comparison baseline is bitcoin’s average absolute close-to-close daily move from Nov. 16, 2022 to Nov. 15, 2026, also from Coinbase data.
The 24-hour window captures the after-hours reaction, the Asian session, and the next full U.S. trading day, when any repricing in Nvidia shares and the Nasdaq would play out.
Nine gains, seven losses, no pattern
Bitcoin was higher 24 hours later after nine of the 16 reports and lower after seven. The median change was +0.31%. That is close to a coin flip with a slight upward tilt, which is about what bitcoin delivers on an ordinary day over a period in which its price rose several times over.
The size of the moves was ordinary too. The mean absolute 24-hour change after Nvidia earnings was 1.68%, matching the four-year average daily move of 1.68% exactly. The median absolute change was 1.48%, somewhat above the 1.17% median for all days. That points to a modestly busier session rather than a volatility event. In 2026 alone, bitcoin’s average daily move has been 1.62%.
The largest gain came after the November 2024 report, when bitcoin rose 4.09% in the following day. The biggest declines were 3.63% after the May 2024 release and 3.44% after the November 2025 release.
The intraday range tells the same story
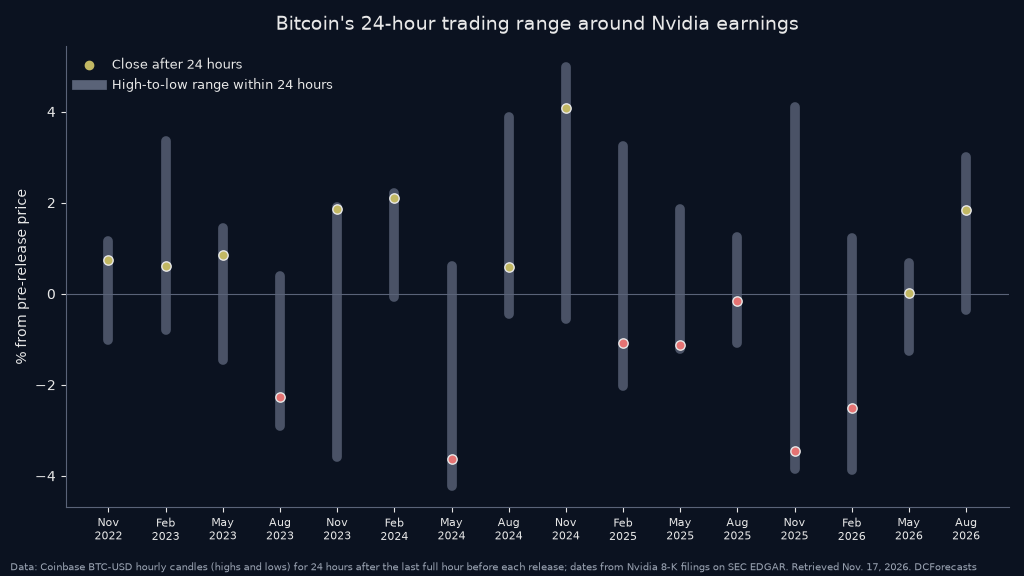
A close-to-close number can hide a wild ride, so the second chart shows the full high-to-low range in each 24-hour window. Most windows span roughly 2% to 6% from top to bottom, with the close landing comfortably inside the range. The widest swing came after the November 2025 report, when bitcoin traded as much as 4.1% above its pre-release level before ending the day 3.4% lower.
Three days later, the signal fades further
Stretching the window to 72 hours makes the Nvidia link look even weaker. Bitcoin was higher three days after six of the 16 reports and lower after ten, with a median change of -0.53%. The spread of outcomes widens with time, as expected, but the sign of the 24-hour move did not reliably carry into the 72-hour result. After the August 2024 report, a 0.59% one-day gain turned into a 0.08% three-day loss. After February 2025, a 1.07% one-day dip became a 1.47% three-day gain.

The most recent four reports show the same mix: -3.44% and -2.52% after November 2025 and February 2026, followed by +0.02% in May 2026 and +1.83% in August 2026.
What matters more for bitcoin this week
None of this means Nvidia is irrelevant. The company is the largest weight in U.S. equity indexes, and a disorderly sell-off in AI stocks can spill into every risk asset. The liquidation wave on Nov. 13 showed how quickly leverage can amplify a move once it starts. A leadership change at the top of Nvidia makes the guidance and the tone of Kress’s first call as interim CEO more important than usual.
But four years of data argue that bitcoin’s own drivers, including spot ETF flows, derivatives positioning and the supply held by long-term holders, have mattered far more than any single chip earnings report. On the 16 nights tracked here, bitcoin behaved like bitcoin on a typical day, not like a leveraged Nvidia proxy.
For long-term holders, that independence is part of the case for the asset. Bitcoin’s fixed 21 million supply and its round-the-clock global market respond to liquidity and adoption, not to quarterly data-center revenue.
Bottom line
Nvidia’s earnings date has become a fixture on crypto calendars, yet bitcoin’s reaction has been statistically ordinary: nine gains in 16 reports, a median move of +0.31%, and an average absolute move equal to a normal trading day. With a new interim CEO presenting results for the first time, Tuesday’s report could rattle tech stocks. On the evidence of the past four years, bitcoin is more likely to take it in stride.
DC Forecasts is a leader in many crypto news categories, striving for the highest journalistic standards and abiding by a strict set of editorial policies. If you are interested to offer your expertise or contribute to our news website, feel free to contact us at [email protected]












Discussion about this post