



Bitcoin has lost 20.4% in a month, sliding from $81,378 on October 17 to $64,817 on November 16, according to Coinbase daily closes. A drop that size used to come with wild daily swings. This time it has not.
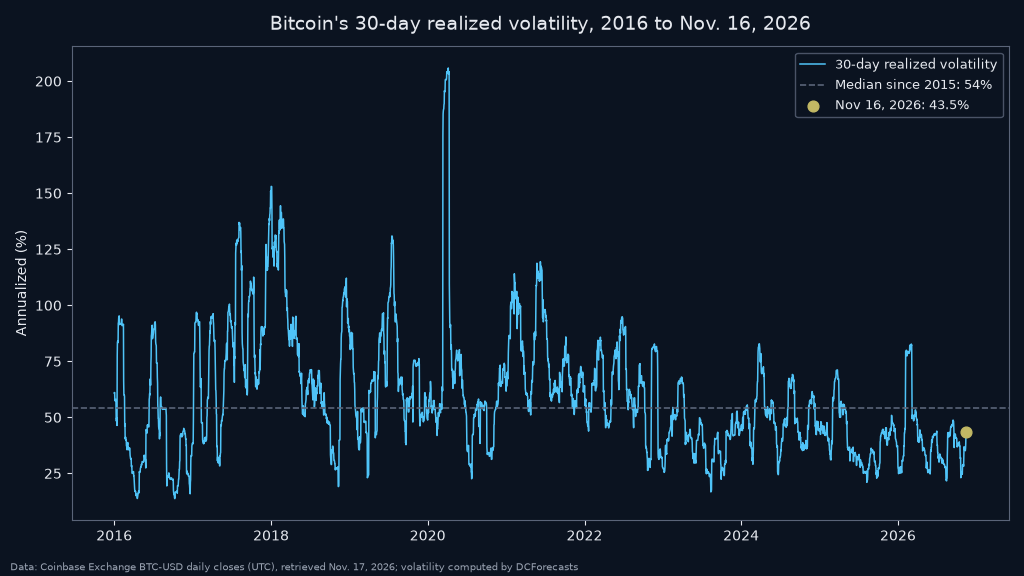
Bitcoin’s 30-day realized volatility, a measure of how much the price moves from day to day, stood at 43.5% on an annualized basis on November 16. That is below the median of 54% since 2015 and lower than on about two-thirds of all days in the data.
For a market that has been tested hard, those numbers point to an orderly sell-off rather than a panic. They also show how much bitcoin volatility has changed as the asset has grown.
A big drop at a calm pace
We looked at every day since 2015 on which bitcoin was down at least 20% over the previous 30 days. There were 322 of them. On a typical one, 30-day volatility ran at 83.4%, almost twice today’s reading.
Only 21 of those sessions had volatility as low as now, or lower. All of them came after mid-2024: one in July 2024, six in November 2025 and 14 in 2026, including the June low and the past few days.
In other words, bitcoin can now fall 20% without the extreme swings that marked earlier cycles. Measured by realized volatility, the current slide looks more like a broad repricing than a forced dash for the exits.
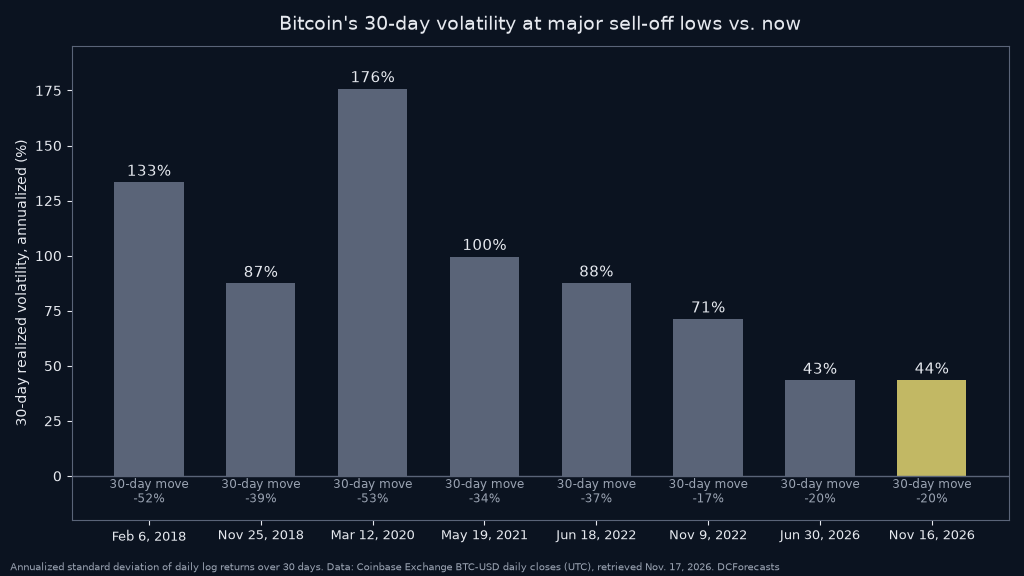
How past lows compare
The contrast with earlier bottoms is clear. In the March 2020 crash, 30-day volatility hit 176% as bitcoin fell 53% in a month. At the February 2018 low it was 133%. In June 2022, after the Terra collapse, it was 88%, and at the FTX low in November 2022 it was still 71%.
The June 30, 2026, low, the weakest close of this year at $58,524, came with volatility of just 43%. That puts it in the same range as today. From that low, bitcoin climbed above $83,000 by the end of September.
The pattern also held through the first half of November, when bitcoin had its weakest start to November since 2022. Selling came in steady waves rather than one capitulation day.

Day by day, the biggest moves of the past month have been modest by bitcoin standards. The largest daily fall was 6.0% on November 14, followed by 5.5% on November 5. The biggest daily gain was 4.0% on November 4.
Why lower volatility matters
Lower crypto volatility does not mean prices can’t fall further. A steady decline can still be a deep one, and bitcoin is now 48% below its October 2025 record close of $124,720.
But calmer trading has practical effects for the investors bitcoin now attracts. Many institutional investors, including the pension funds, wealth managers and sovereign funds that now report spot bitcoin ETF holdings, size positions with volatility in mind. When bitcoin price volatility is lower, the same risk budget can hold a larger position. That makes it easier for those buyers to stay in the market during drawdowns like this one, and to add exposure when they see value.
The yearly averages tell the story of a maturing asset. Bitcoin’s 30-day volatility averaged 82.9% in 2017 and 77.6% in 2021. It averaged 40.4% in 2025 and 40.7% so far in 2026.
Fear without the frenzy
Other gauges show that sentiment is badly shaken. The Fear and Greed Index fell to 10, daily RSI dipped toward 20, and bitcoin has just closed below its 200-week moving average. In the options market, the $60,000 put has become the largest single position.
Yet the price itself has moved in a measured way. In past cycles, that kind of fear usually came with volatility well above 80%. The gap between how traders feel and how the price is actually moving is one of the more interesting features of this market.
What the data can and cannot say
Our figures use the annualized standard deviation of daily log returns over 30 days, based on Coinbase’s BTC-USD daily closes in UTC from July 2015. Other venues and methods, such as options-implied volatility, will give somewhat different numbers.
Realized volatility looks backward. A sudden spike can still come, as it did in late February and early March 2026, when 30-day volatility briefly topped 80% and peaked at 82.7%. Low volatility also does not mark a bottom on its own.
What the record does show is that this 20% decline has been one of the calmest on record. The deepest past drawdowns came with volatility above 70%. For long-term holders, a bitcoin that can absorb a correction this size without a frenzy is a sign of a deeper, more stable market, and that is a solid base for the next leg higher.
DC Forecasts is a leader in many crypto news categories, striving for the highest journalistic standards and abiding by a strict set of editorial policies. If you are interested to offer your expertise or contribute to our news website, feel free to contact us at [email protected]












Discussion about this post