



The crypto sell-off has now taken almost a fifth off Bitcoin’s price in a month, yet most of the market’s other large coins have fared worse. CoinGecko data retrieved at 18:47 UTC on Saturday showed Bitcoin at $65,604, down 19.8% over 30 days.
We lined that number up against the 13 next-largest cryptocurrencies that are not stablecoins, wrapped tokens or exchange tokens.
Nine of those 13 fell further than Bitcoin. Only four held up better.
That gap matters because it shows where investors keep their money when the pressure builds. The bigger question is whether that preference survives the next leg of this market.
Nine of 13 Large Coins Fell Further Than Bitcoin
Cardano had the deepest 30-day loss in the group at 32.1%, followed by Solana at 31.1% and XRP at 28.3%.
Zcash fell 27.5%, Chainlink 26.3%, Stellar 26.0%, Dogecoin 25.3%, Bitcoin Cash 24.8% and Ethereum 24.4%.
The four that lost less were Monero at 6.4%, TRON at 7.4%, Hyperliquid at 18.8% and BNB at 19.3%. The last two finished within about a percentage point of Bitcoin.
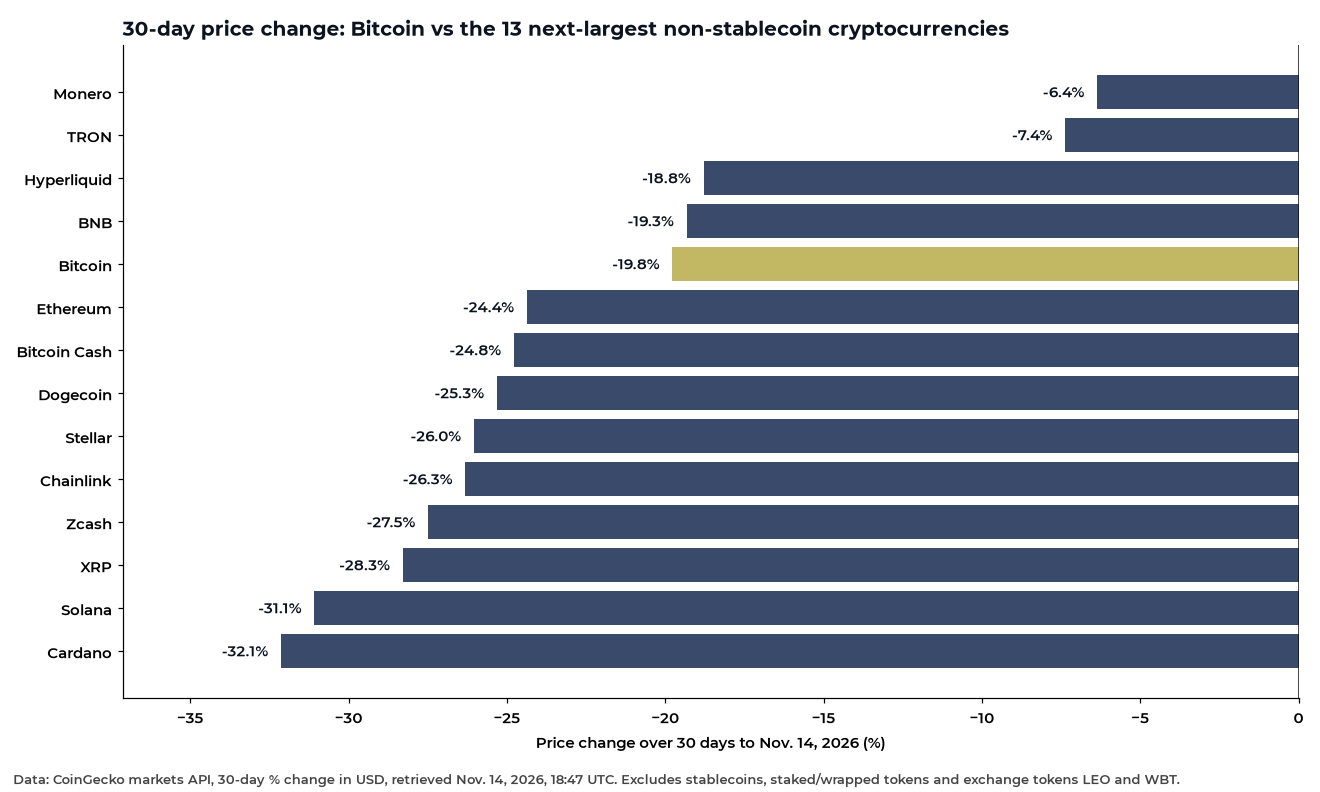
We want to be clear about what this chart does and does not show. Bitcoin fell hard, and that is the plain fact of the month.
What the chart adds is the comparison. In a broad crypto sell-off, the asset with the deepest liquidity and the largest institutional base lost less than most of its large peers.

How the Crypto Sell-Off Unfolded Since Mid-October
Indexed to 100 on Oct. 16, the four largest non-stablecoin assets moved almost together for the first two weeks.
The split opened after Oct. 30 and widened in November. By Saturday evening, Bitcoin’s index stood near 80, while Ethereum was near 75, XRP near 71 and Solana near 68.
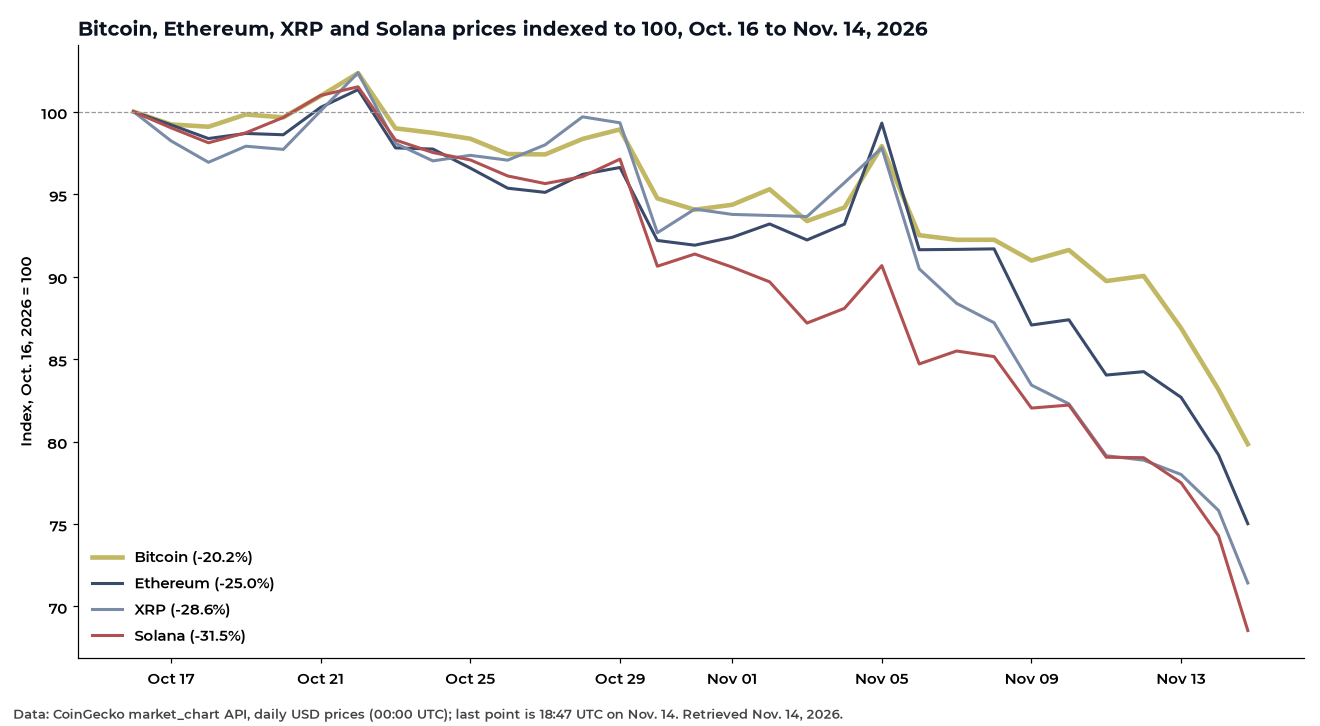
The last week did most of the damage. Over seven days, Bitcoin fell 13.1%, against 17.6% for Ethereum, 17.4% for XRP and 18.7% for Solana.
Saturday’s slide pushed Bitcoin to its lowest levels since August. As we covered in our look at Bitcoin’s busiest Saturday since February, that move came on unusually heavy weekend trading.
Bitcoin Dominance Sits Near 59%
CoinGecko put Bitcoin’s share of the total crypto market value at 58.91% at the time of our pull. Ethereum’s share was 10.0%.
The total market stood at about $2.24 trillion, down 6.9% over 24 hours.
Bitcoin dominance tends to rise when capital pulls back from riskier tokens toward the market’s deepest asset. Saturday’s reading is consistent with that pattern, even with Bitcoin itself under pressure.
It also cools talk of an altcoin season for now. Rotations into smaller coins have usually needed a rising Bitcoin first, not a falling one.
The Distance From Each Peak Tells a Similar Story
The longer view points the same way. Bitcoin’s record on CoinGecko is $126,080, set on Oct. 6, 2025. At $65,604, it trades 48% below that high.
Ethereum peaked at $4,946 on Aug. 24, 2025, and now sits 63% lower. XRP is 74% below its $3.65 record from July 17, 2025.
Solana’s peak of $293.31 came on Jan. 19, 2025, and it is down 75% from there.
Those are heavy drawdowns across the board. Still, Bitcoin has kept far more of its cycle gains than the large coins that peaked in the same 2025 window.
We explored how this cycle’s decline compares with earlier ones in our analysis of Bitcoin’s drawdown 403 days after its peak.
ETF Selling Is Part of the Picture
The pressure has not come only from crypto-native traders. U.S. spot Bitcoin ETFs saw net outflows of about $1.07 billion from Nov. 9 to Nov. 13, according to Farside Investors data.
Every session that week was negative, and BlackRock’s IBIT accounted for roughly $908 million of the total.
We read that as a meaningful headwind, not a verdict. Bitcoin absorbed a week of fund redemptions and still lost less than most large altcoins over the month.
The ETF structure also cuts both ways. The same pipes carrying money out this month carried in a net $54.7 billion since launch, by Farside’s running total.
What We Are Watching as the Sell-Off Matures
Our watch list is short. First, whether dominance holds near 59% if prices stabilize, which would confirm that capital is staying with Bitcoin rather than leaving crypto.
Second, the daily ETF flow prints. A run of smaller outflows, or a first inflow day, would signal that institutional selling is easing.
Third, the gap in our second chart. If Bitcoin’s index keeps falling more slowly than Ethereum’s and Solana’s, that relative strength becomes a trend rather than a single month’s result.
We believe that relative strength is the clearest signal in this crypto sell-off. Sell-offs test every asset at once, and they tend to show which ones investors trust most.
Bitcoin’s fixed supply, deep liquidity and ETF access give it advantages few rivals share. The coming weeks will show whether its smaller drawdown becomes the base for the next recovery.
DC Forecasts is a leader in many crypto news categories, striving for the highest journalistic standards and abiding by a strict set of editorial policies. If you are interested to offer your expertise or contribute to our news website, feel free to contact us at [email protected]












Discussion about this post