



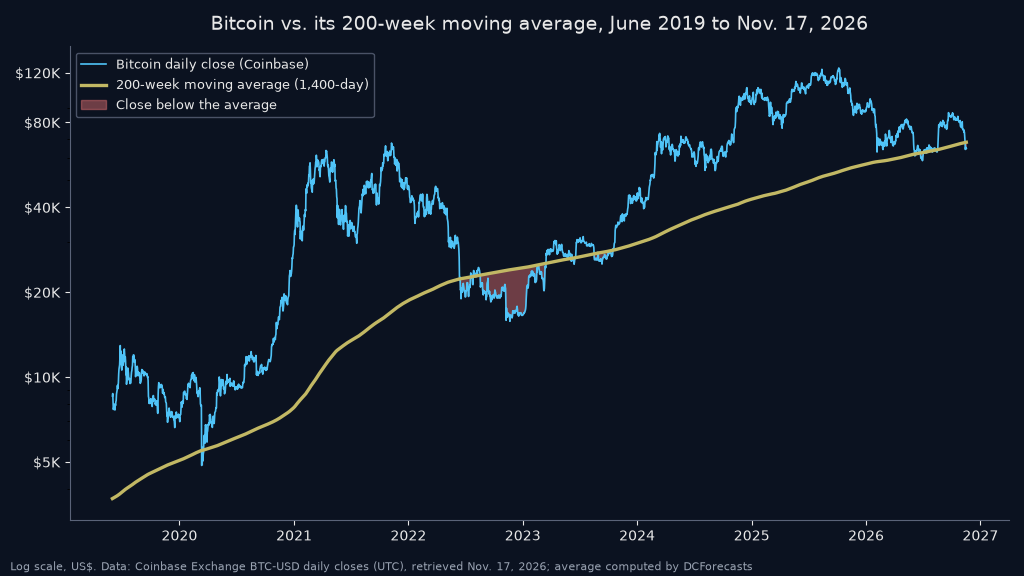
Bitcoin has closed below its 200-week moving average for three straight days. On November 16 it finished at $64,816.79 on Coinbase, 4.6% under the long-term average of about $67,970.
The first close under the line came on November 14, at $64,118.79, or 5.6% below. Before that, bitcoin had stayed above the average since mid-August, and as recently as early October it was trading almost 30% above it.
The 200-week moving average is one of the slowest trend lines in bitcoin analysis. It smooths out almost four years of prices, roughly one full halving cycle. Many long-term investors treat it as a rough bitcoin support level for bear markets rather than a trading signal.
A rising floor, not a falling one
The average itself is still climbing. As we showed last week, when the 200-week line set a record at $67,754, it has not had a weekly decline since our data begins in 2019. Measured on daily closes, it is now about 23% higher than a year ago, and it has gained at least 18% over every 12-month stretch in the sample.
That changes how this break looks. When bitcoin first slipped under the line in June 2022, the average stood near $22,300. Now it sits close to $68,000. Even after a fall of almost 48% from the October 2025 record close of $124,720, bitcoin is trading within 5% of a floor that is about three times higher than it was in the last bear market.
Every past break was reclaimed
To test the history, we calculated the btc 200-week moving average as a simple average of 1,400 daily Coinbase closes. Coinbase’s daily series starts in July 2015, so the first full reading comes in 2019. That leaves out the 2015 and 2018 lows, and other data providers that use weekly closes may get slightly different numbers.
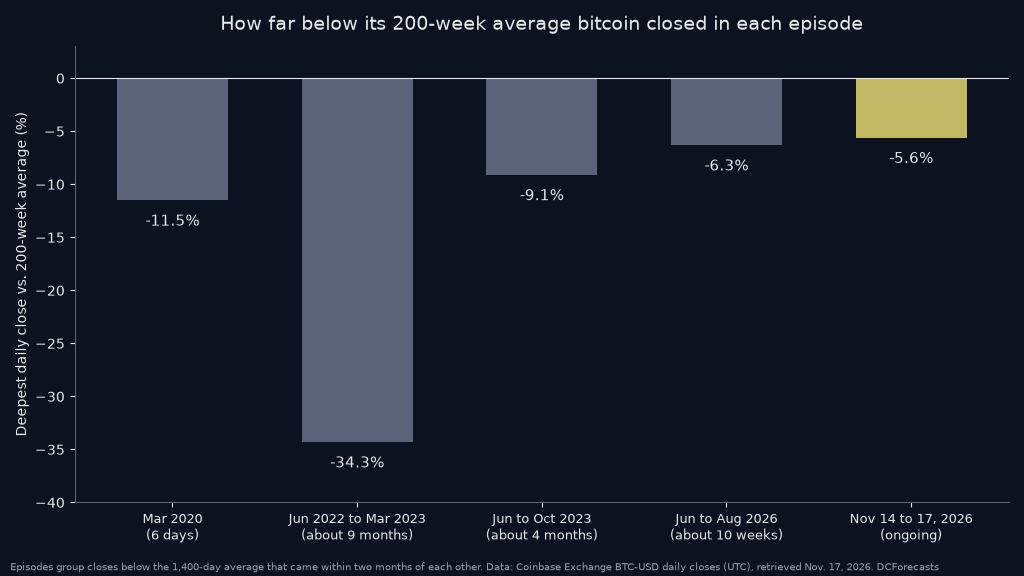
Grouping closes below the line that came within two months of each other, we found four earlier episodes:
- March 2020: six daily closes below during the pandemic crash, with the deepest at 11.5% under the average on March 12.
- June 2022 to March 2023: the long one. Bitcoin closed below the line on and off for about nine months and bottomed 34.3% under it on November 21, 2022.
- June to October 2023: a shallow run of closes below, never more than 9.1% under.
- June to August 2026: about 10 weeks around the line, with a low of 6.3% under on June 30.
In every case, bitcoin went on to close back above the average.
What happened after the first close below
The more useful question for today is what followed the first close under the line, since that is where bitcoin stands now. Here is the record from the first close below in each earlier episode:

- March 12, 2020 ($4,857): up 104% after 90 days and more than 11 times higher a year later.
- June 14, 2022 ($22,120): up 1% after 90 days, down 23% after 180 days and up 14% after a year.
- June 5, 2023 ($25,742): roughly flat after 90 days, up 53% after 180 days and up 174% after a year.
- June 5, 2026 ($61,032): up 33% after 90 days.
Every one of those starting points was higher a year later where a full year of data exists. The 2026 case is the freshest. After its last close below on August 16, at $62,836.66, bitcoin climbed 33% to $83,556.14 by September 30.
The record also comes with a clear warning. The 2022 break was not a quick dip. Price fell much further first, to 34% under the average, and stayed below it for most of nine months. Buyers on the first close below had to sit through a 23% loss at the six-month mark before the recovery.
How this fits with other signals
The 200-week line is one of several gauges that have turned cautious in the last week. The Mayer Multiple has slipped to 0.90, the daily RSI has hovered near oversold levels, and the 50-day average is closing in on a death cross.
Read together, they describe a market that has lost momentum but is near levels that long-term buyers have used before. Any bitcoin moving average reflects past prices, so none of these signals can show where the bottom will be. They only show where bitcoin stands against its own history.
The level to watch
The simplest test is a close back above roughly $68,000. Because the average keeps rising by roughly $35 to $40 a day, that bar gets a little higher each week bitcoin stays below it.
In all four earlier episodes in our data, bitcoin cleared that bar in the end. In 2020 it took days, and in mid-2026 about 10 weeks. The 2022 bear market showed that it can take much longer. History doesn’t guarantee a repeat, but it shows that the 200-week moving average has kept marking zones where patient holders were later paid for waiting.
DC Forecasts is a leader in many crypto news categories, striving for the highest journalistic standards and abiding by a strict set of editorial policies. If you are interested to offer your expertise or contribute to our news website, feel free to contact us at [email protected]












Discussion about this post