



The Bitcoin selloff since early October did not hit every part of the trading day equally. Hours when Asia is awake did the most damage, while the US session, where most of the dollar volume trades, has been close to flat over three months.
We split Coinbase’s BTC-USD hourly price data into four blocks of the UTC day. Since Oct. 6, 2026, Bitcoin has fallen 24.04%, from an opening price of $85,749 to $64,923 late on Nov. 17.
Asian hours account for the largest share of that drop. For investors trying to read the selloff, that matters.
The bigger question is whether the selling reflects lasting demand loss, or pressure that tends to show up when liquidity is thinnest.
How we measured the Bitcoin selloff by session
Bitcoin trades nonstop, so there is no official session. We used four simple UTC windows.
- Asia: 00:00 to 08:00 UTC
- Europe: 08:00 to 14:00 UTC
- US: 14:00 to 21:00 UTC, which covers the New York stock market day
- Late US: 21:00 to 24:00 UTC
For each hour, we took the change from open to close and added it to its session’s running total. The four totals multiply back to Bitcoin’s full move over the period.
This is a descriptive split, not proof of who was selling. Traders in every region trade at all hours.
Asian hours took 9.6% off Bitcoin since Oct. 6
Over the 1,032 hours from Oct. 6 to Nov. 17, hours in the Asia block lost a combined 9.62%. Europe hours lost 7.21%, US hours 7.11% and late US hours 2.51%.
The volume split tells the more interesting story. Asia hours carried only 24.8% of Coinbase’s dollar volume in that stretch, while US hours carried 43.3%.

In other words, the heaviest losses came in hours with far less money changing hands on this US exchange.
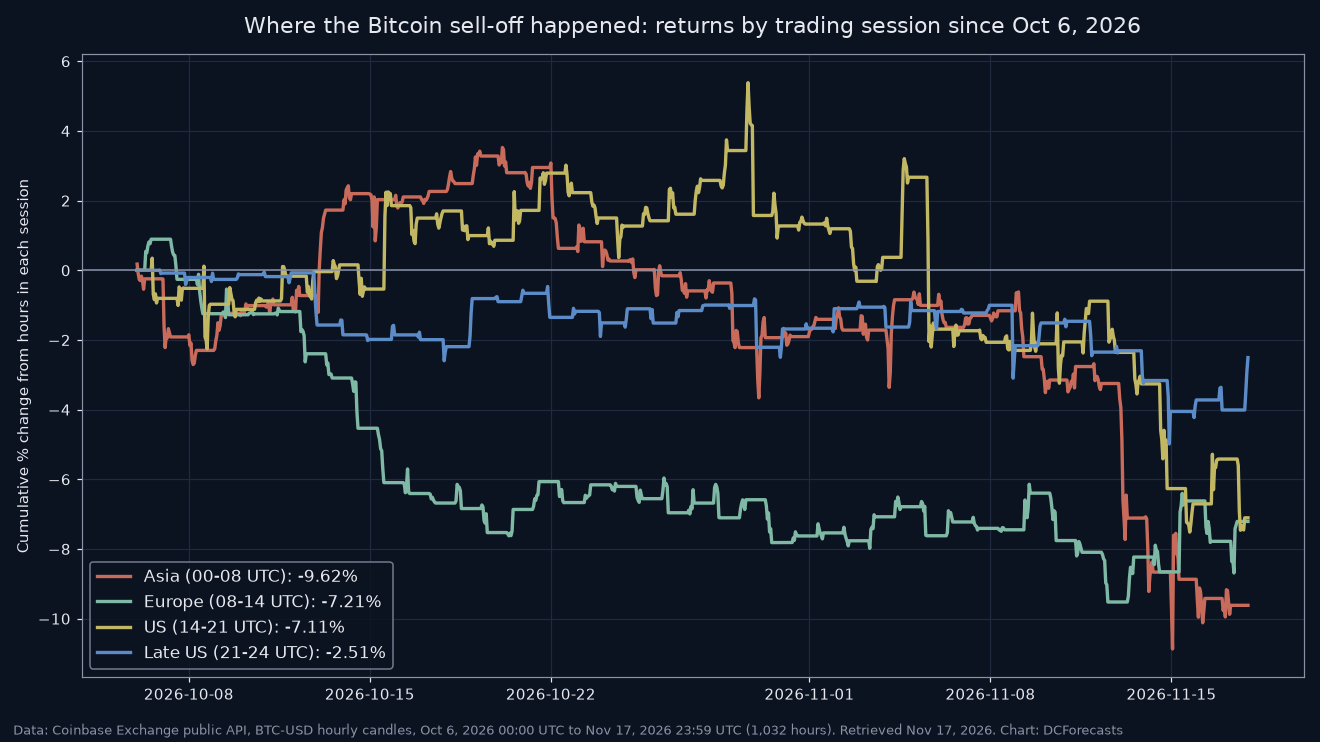
The chart also shows when it happened. Europe hours did most of their damage in mid-October, while the Asian block’s steepest leg came in the middle of November.
We believe that pattern is a sign of thin-market selling rather than broad capitulation. Moves made on lighter volume can reverse faster once deeper liquidity returns.
The hourly detail is noisier. Since Oct. 6, the hour starting at 15:00 UTC lost a combined 7.2%, the worst single hour of the day, while the hour just before it, starting at 14:00 UTC, gained 3.9%. The hours starting at 01:00 and 12:00 UTC were also weak, down 6.2% and 5.2%.
That spread is a reminder that no single hour tells the full story. The session totals smooth out much of that noise.
Three months show a very different US picture
Stretch the window back to Aug. 18 and the picture changes. Over those 2,208 hours, Bitcoin is up 0.93% overall, from $64,477 to $64,923, despite climbing to a high of $87,397 on Sept. 21 along the way.
By session, Europe hours gained 12.78%. US hours slipped only 0.19%. Asia hours fell 8.91%, and late US hours 1.57%.
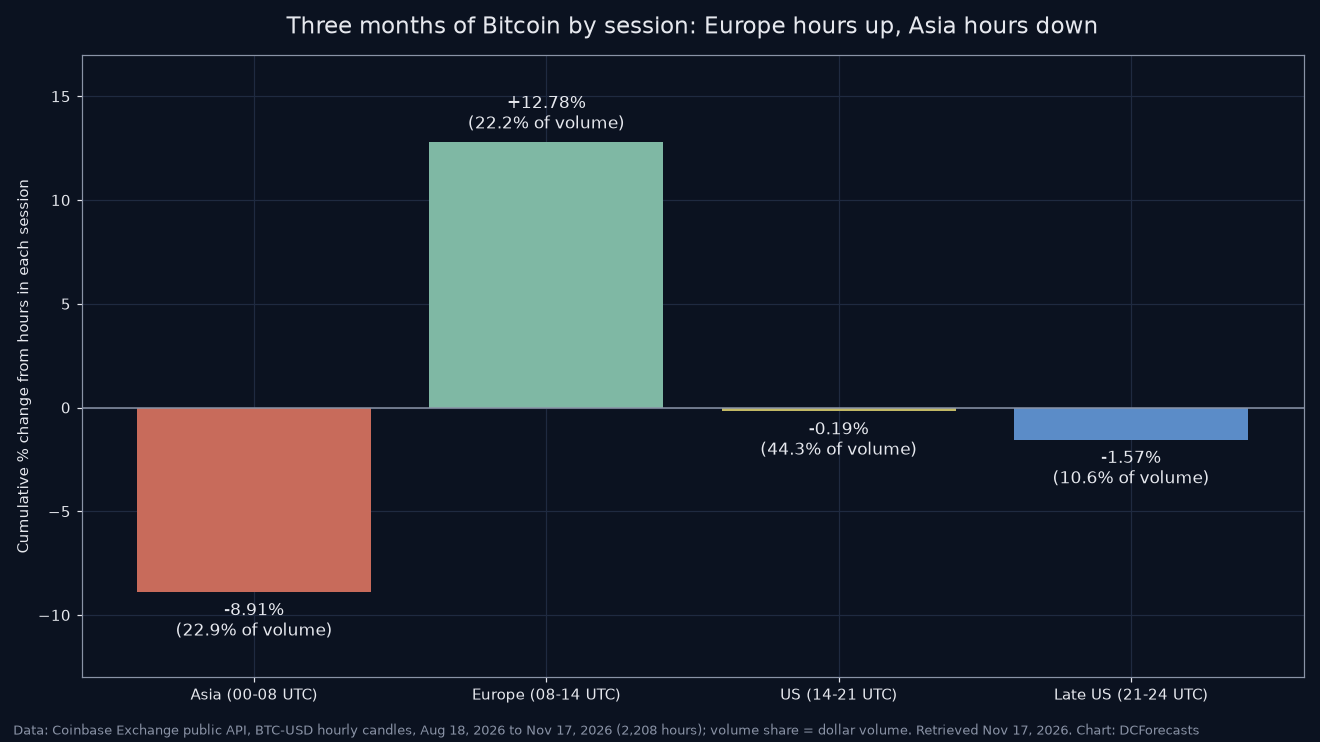
US hours carried 44.3% of the dollar volume in this period. That is the window when spot Bitcoin ETFs trade and when most US institutions are active.
For us, the key takeaway is that the deepest pool of US liquidity has not been a net seller over three months. It has been roughly neutral, even through a 26% drop from the September high.
What the session data says about who is selling
Caution is needed here. Hourly returns cannot identify individual sellers, and a price drop in Asian hours can be driven by traders anywhere.
Still, the evidence fits other signals we have tracked. Grayscale has tied the recent weakness to stablecoin outflows rather than forced selling by large holders, and our volatility work showed the monthly drop was calmer than past selloffs.
Session data adds a third piece. The selling has been concentrated in thinner hours, while the main US window has absorbed supply without a lasting decline.
We believe that is a healthier backdrop than the headline 24% drop suggests.
What would mark a turn in this Bitcoin selloff?
We would watch two things. First, whether the Asian block stops bleeding. A run of flat or positive Asian sessions would suggest the overnight supply is drying up.
Second, whether US hours start to lead. If the session with 43% to 44% of the dollar volume turns positive while the others stabilize, buyers would be back in control where liquidity is deepest.
None of this guarantees a bottom. Bitcoin can keep falling in any session, and thin hours can stay weak for weeks.
But the long-term case is unchanged. Supply is fixed, institutional rails keep growing, and the deepest market hours have held steady through the decline.
The coming weeks will reveal whether the overnight pressure fades. If it does, the hours that did the least damage may be the ones that lead the recovery.
DC Forecasts is a leader in many crypto news categories, striving for the highest journalistic standards and abiding by a strict set of editorial policies. If you are interested to offer your expertise or contribute to our news website, feel free to contact us at [email protected]












Discussion about this post