



Bitcoin’s selling pressure has pushed one of the market’s most-watched momentum gauges into rare territory. Its 14-day relative strength index (RSI) closed at 20.9 on Nov. 18, the sixth straight day below 25.
That streak ties the second-longest since 2015. Only November 2018, at 14 days, ran longer. Over more than 11 years of daily data, Bitcoin’s RSI has closed below 25 on just 63 of 4,125 days, or about 1.5% of the time.
Extreme readings like this have usually come late in a sell-off rather than early. We measured what happened next using Coinbase daily closing prices.
What the RSI Is Telling Traders Now
The RSI compares the size of recent gains with recent losses on a scale of zero to 100. Readings above 70 are often read as overbought, and readings below 30 as oversold. We used the standard 14-day setting with Wilder’s smoothing on daily closes.
The indicator was introduced by technical analyst J. Welles Wilder Jr. in 1978 and is now one of the most common tools on any trading screen. Because so many traders watch the same levels, deep oversold readings can become a focal point for dip buyers.
Bitcoin’s RSI dropped below 30 on Nov. 12, slipped under 25 the next day, and briefly closed at 19.95 on Nov. 14. Since then it has hovered between about 21 and 25 as the price slid from $68,236.54 on Nov. 13 to $62,175.62 on Nov. 18.
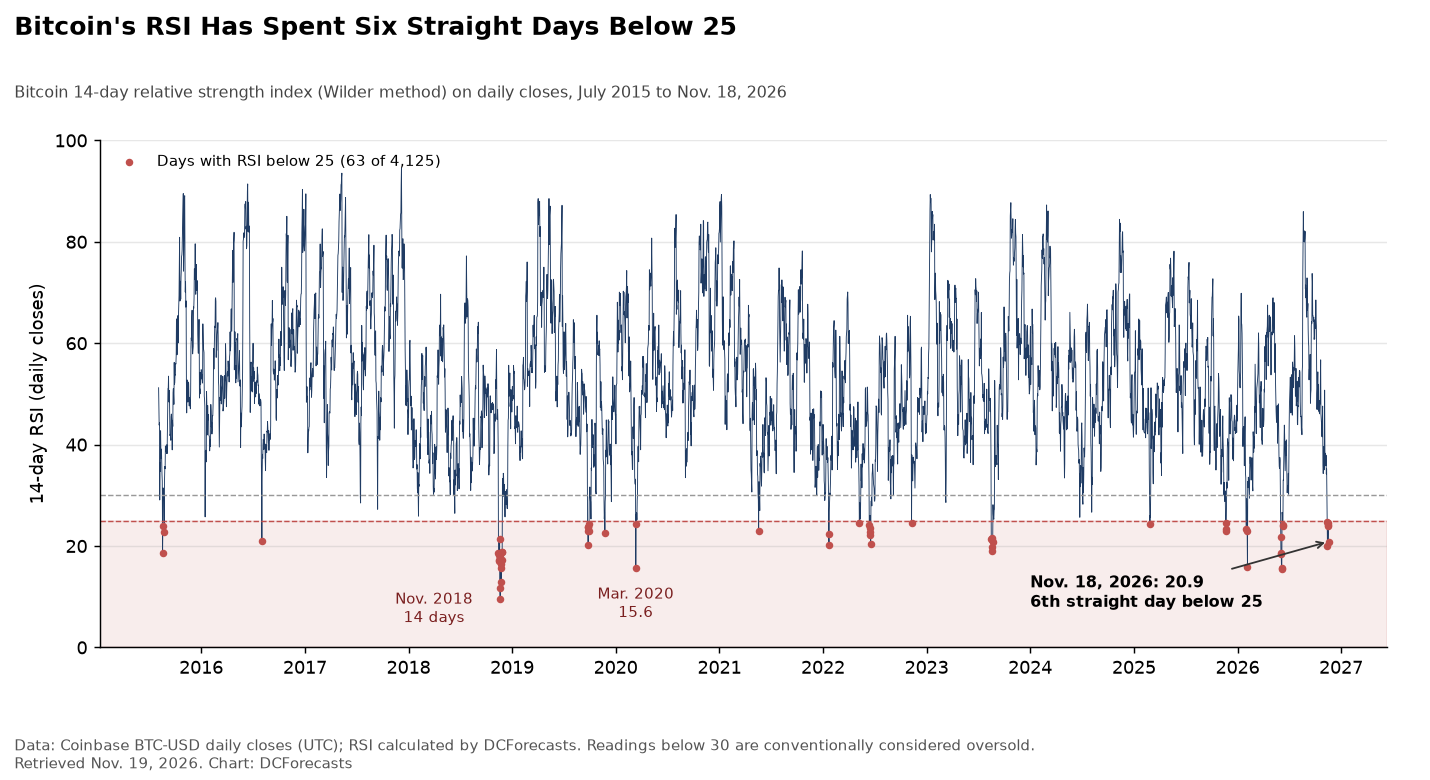
The two other six-day streaks came in September 2019 and August 2023. The 2023 episode was followed by a 42.3% gain over the next 90 days. The 2019 one was not, with Bitcoin 14.3% lower three months later.
How Bitcoin Performed After Oversold Readings
To avoid counting the same sell-off twice, we took the first close below each level and required at least 30 days between episodes. The results improve as the readings get more extreme.
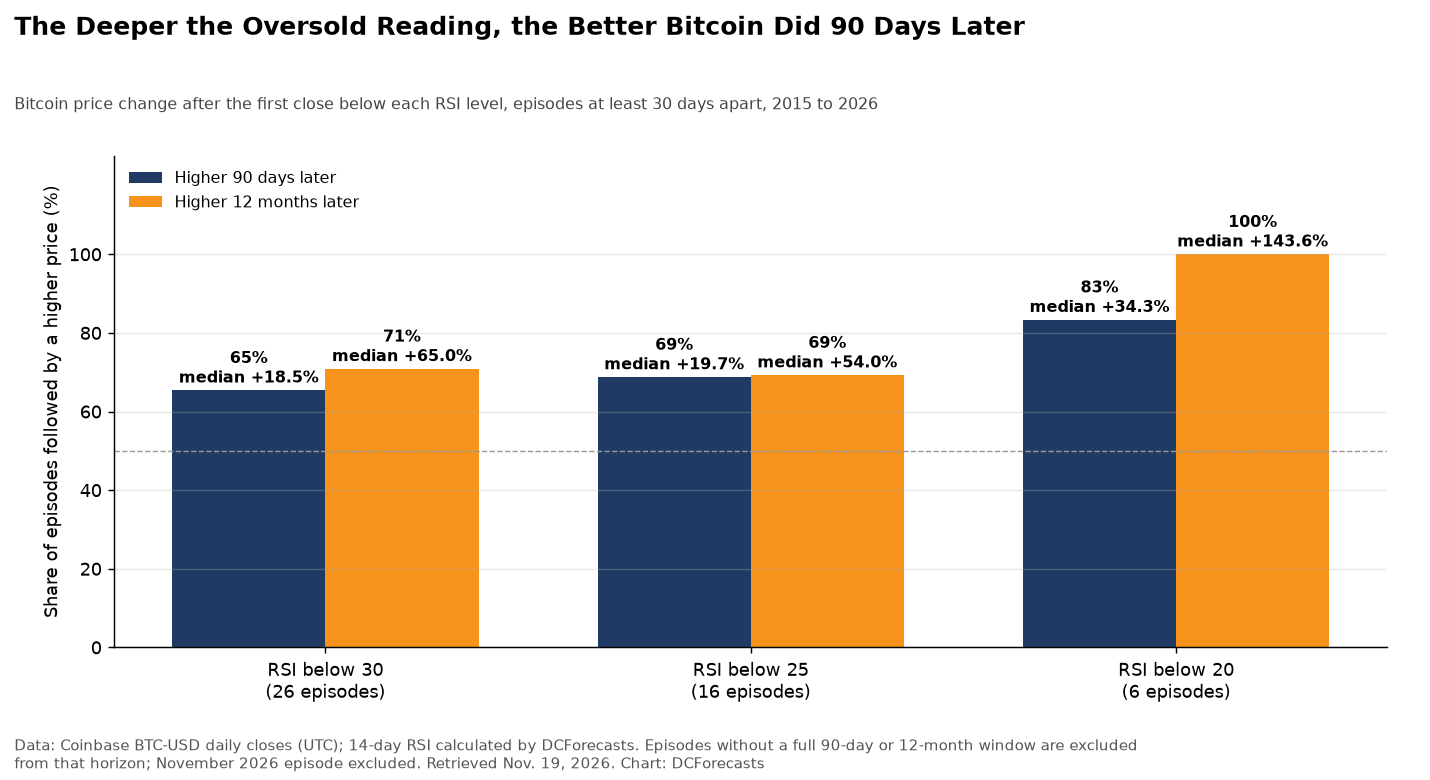
After the 26 completed episodes below 30, Bitcoin was higher 90 days later 17 times, or 65%, with a median gain of 18.5%. After readings below 25, the hit rate rose to 11 of 16, or 69%, with a median gain of 19.7%.

The deepest readings, below 20, have been the most rewarding. Bitcoin was higher 90 days later in five of six cases, with a median gain of 34.3%. All four with a full year of data ended the next 12 months higher, with a median gain of 143.6%.
The 30-day window was far less reliable. After RSI fell below 30, Bitcoin was higher a month later in only 12 of 26 cases. Oversold conditions have tended to resolve over months, not days.
The Six Times Bitcoin’s RSI Broke Below 20
The list of sub-20 readings reads like a map of major turning points. In August 2015, Bitcoin closed at $221.99 when its RSI hit 18.7, then rose 50% over the next 90 days. In March 2020, during the Covid crash, the RSI hit 15.6 with Bitcoin at $4,857.10. Ninety days later it was up 103.7%, and a year later it had gained 1,078%.
In August 2023, a reading of 19.0 at $26,048.89 came before a 38.8% rise over 90 days. That rally carried into the 2024 bull run.
November 2018 is the exception and the warning. The RSI first broke below 20 on Nov. 14 with Bitcoin at $5,605.46. The price kept falling to $3,183 by Dec. 15 and was still 36% lower 90 days later. Yet even that episode ended the following 12 months 54% higher.
This year has already produced two sub-20 readings before this month. The RSI hit 15.9 on Feb. 5 with Bitcoin at $62,791, and the price was 29.7% higher 90 days later. It hit 18.7 on June 3 at $64,040, followed by a 20.9% gain over the next 90 days.
Where Bitcoin Stands Now
Bitcoin traded near $62,554 early on Nov. 19, down about 2.8% over 24 hours, according to CoinGecko. That puts the price within a few percent of where the February and June oversold readings occurred.
The RSI signal also lines up with other stress gauges we have tracked. Sentiment hit extreme fear, as our fear and greed index analysis showed, and Bitcoin has slipped below its 200-week moving average. Our cycle check puts the current drawdown at about 50% from the October 2025 peak.
The caveats are real. The RSI measures momentum, not value, and it can stay low for weeks in a steady decline, as 2018 proved. Sample sizes for the most extreme readings are small, so the pattern is a guide rather than a rule.
Why Oversold Readings Have Favored Patient Holders
Still, the record leans in Bitcoin’s favor. Across every completed episode below 25, the median 12-month gain was 54%. Readings this deep have tended to show up near exhaustion, when forced sellers are running out and longer-term buyers start to step in.
With Thanksgiving week ahead, a season that has been a coin flip for Bitcoin over the short run, the RSI points to the same lesson: the next few days are hard to call, but deeply oversold markets have rarely stayed that way for long.
DC Forecasts is a leader in many crypto news categories, striving for the highest journalistic standards and abiding by a strict set of editorial policies. If you are interested to offer your expertise or contribute to our news website, feel free to contact us at [email protected]












Discussion about this post