



The Federal Reserve is back in hiking mode, and Bitcoin traders are bracing for more. But the record since 2015 suggests a Fed rate hike has been a short-term headache for Bitcoin, not a long-term verdict.
We matched every increase in the federal funds target since December 2015 with Coinbase daily closing prices. Bitcoin was lower 30 days after most hikes. Twelve months later, it was higher after 16 of the 20 hikes that have a full year of data, with a median gain of 69.8%.
That history matters now. The Fed raised its target range to 3.75%–4.00% on Sept. 17, its first increase since July 2023, according to the Fed’s own table of rate changes. Bitcoin closed at $62,175.62 on Nov. 18, down 18.3% from its close the day before that hike.
What the Fed Is Signaling
The minutes of the Oct. 27–28 meeting, released on Nov. 18, left little doubt about direction. “Almost all participants judged that, under their baseline outlooks for inflation and the labor market, further action to raise the target range for the federal funds rate … would likely be appropriate,” the minutes said.
We covered the details in our report on what the Fed minutes showed. The short version is that more hikes are the base case, with the next decision due Dec. 8–9.
It is a sharp turn. The Fed cut rates three times in late 2025, in September, October and December, taking the range down to 3.50%–3.75% before reversing course this year.
So the useful question is not whether hikes are coming. It is how Bitcoin has behaved once they arrive.
Every Fed Rate Hike Since 2015, Measured
There have been 21 increases in the target range since December 2015: nine in the 2015–2018 cycle, 11 in 2022–2023, and one so far in 2026. For each, we measured Bitcoin’s move from the close the day before the new target took effect.
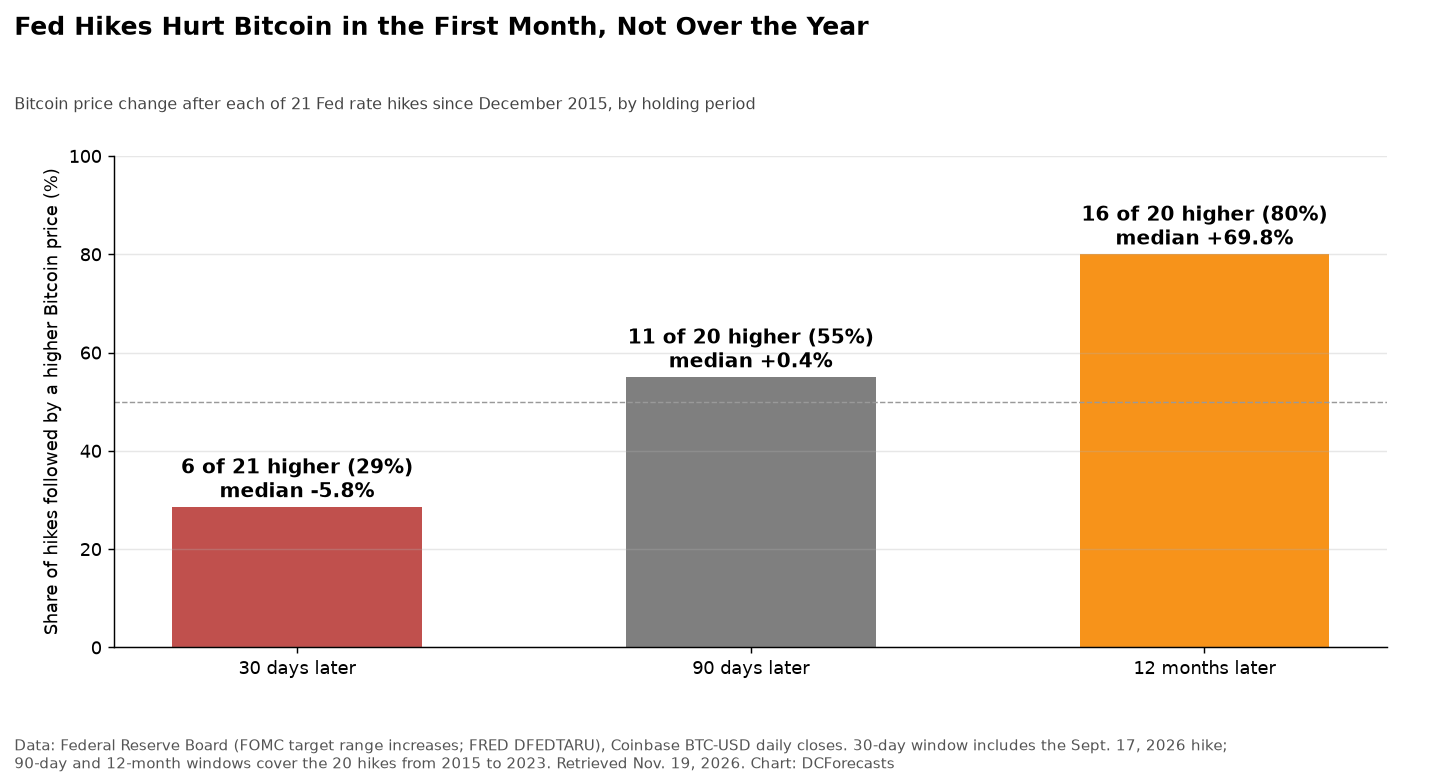
The first month was usually rough. Bitcoin was higher 30 days later after only six of 21 hikes, and the median move was -5.8%.

By 90 days, the picture was a coin flip. Bitcoin was up after 11 of 20 hikes, with a median change of +0.4%.
At 12 months, the pattern flipped clearly. Bitcoin was higher after 16 of 20 hikes. The median gain was 69.8%, and the average was 178.4%, pulled up by the 2016 and 2017 bull run.
The Four Hikes That Didn’t Work Out
The four losing cases share one feature: they came close to a cycle top.
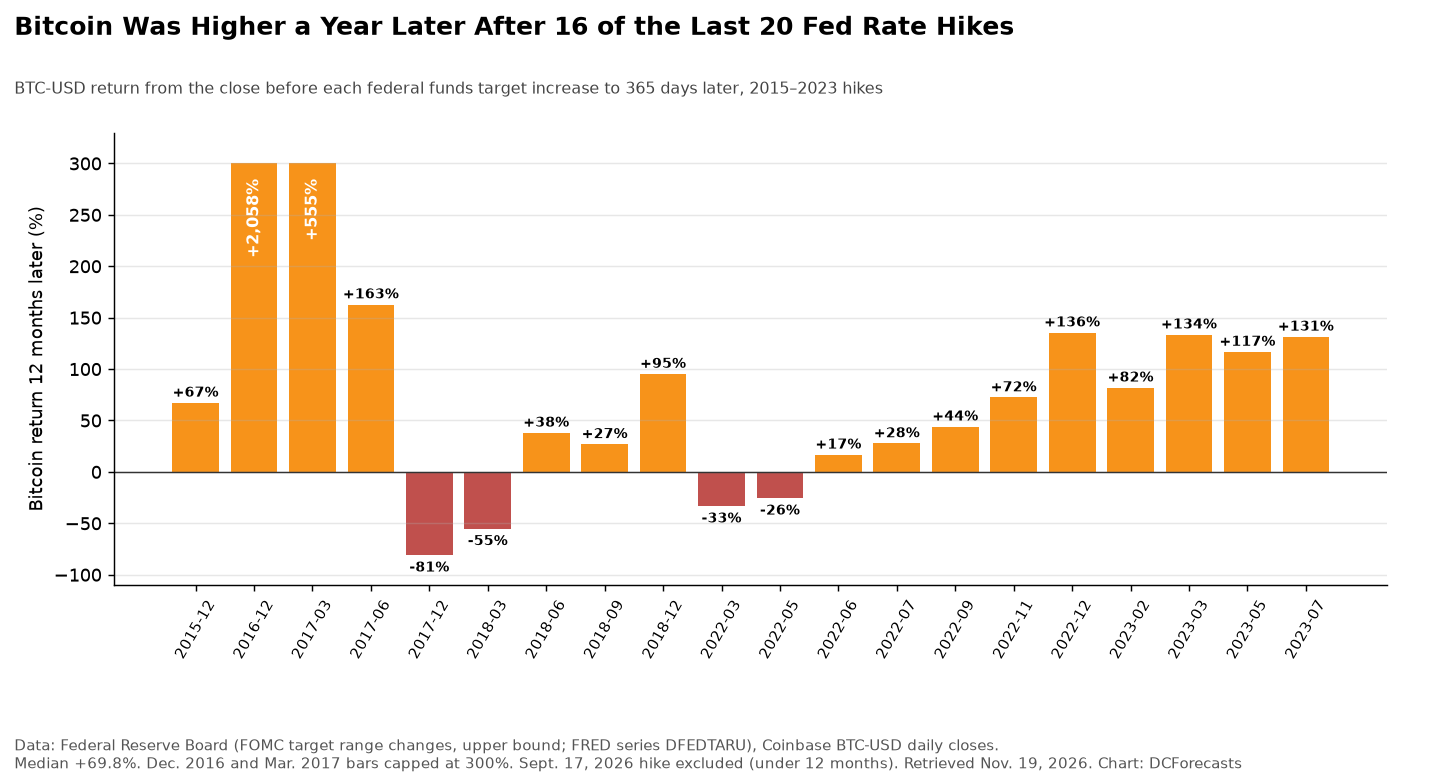
The December 2017 hike landed when Bitcoin was near $16,690, days before its peak that year, and the next 12 months brought an 80.9% drop. The March 2018 hike was followed by a 55.2% decline. In 2022, the hikes in March and May were followed by 12-month losses of 33.2% and 25.5%.
After that, the losses stopped. Every hike from June 2022 through July 2023 was followed by a 12-month gain, ranging from 16.7% to 135.5%.
That is the most striking part of the record. Bitcoin hit its 2022 low of $15,760 on Nov. 21, 2022, while the Fed was still tightening. Five more hikes followed, and Bitcoin rose anyway.
Two Hiking Cycles, Two Very Different Paths
Across the full 2015–2018 cycle, Bitcoin climbed from $464 to $4,075, a gain of 777.8%, even after the 2018 bear market. The 2022–2023 cycle was harder. Bitcoin finished the run of 11 hikes 29.0% below where it started, at $29,215.
The first hike of each cycle also played out differently. After the December 2015 increase, Bitcoin fell 23.0% in 30 days, then finished the year 67.2% higher. After the first 2022 hike in March, it slipped only 1.8% in the first month but was 33.2% lower a year later. The single best case came after the December 2016 hike, when Bitcoin gained 2,058% over the following 12 months.
What came after the last hike was strong both times. Bitcoin rose 76.4% in the 12 months after the December 2018 hike and 132.5% after the July 2023 hike.
The obvious caveat is sample size. Twenty data points across two cycles cannot prove cause and effect, and Bitcoin’s own four-year rhythm, which we tracked in our latest cycle check, overlaps heavily with the Fed’s calendar. Liquidity matters too, as our look at the end of quantitative tightening showed.
Where the 2026 Hike Leaves Bitcoin
The current cycle is only one hike old. Bitcoin actually rose 6.9% in the 30 days after the Sept. 17 increase and briefly closed at $86,594.94 on Sept. 21, before the broader sell-off took over. It traded near $62,670 early on Nov. 19, down about 2.7% over 24 hours, according to CoinGecko.
If more hikes come as the minutes suggest, history points to more short-term pressure. But it also shows that hikes alone have rarely kept Bitcoin down for long. In both previous cycles, the bigger move came while the Fed was still tightening or soon after it stopped.
We read that as a reason for patience rather than panic. Rate hikes raise the cost of money in the near term, but Bitcoin’s fixed supply has outlasted every tightening cycle it has faced so far. The Dec. 8–9 meeting is the next test.
DC Forecasts is a leader in many crypto news categories, striving for the highest journalistic standards and abiding by a strict set of editorial policies. If you are interested to offer your expertise or contribute to our news website, feel free to contact us at [email protected]












Discussion about this post