



Bitcoin’s slide has pulled the price back toward levels it first reached in 2021. But a dollar in 2021 is not the same as a dollar today, and neither is a dollar from 2017. Adjust the chart for inflation and the picture changes in both directions.
Bitcoin closed at $62,981.71 on Coinbase on Nov. 18. Restated in October 2026 dollars, its December 2017 peak was worth $26,902. That puts today’s price 2.3 times above the top of the 2017 bubble, even after accounting for seven years of rising prices.
We rebuilt Bitcoin’s full Coinbase price history in today’s dollars using the U.S. Bureau of Labor Statistics consumer price index for all urban consumers (CPI-U). The results show where the market really stands against its past cycles.
How Much the Dollar Has Lost Since Bitcoin’s Big Peaks
The CPI-U stood at 337.511 in October 2026, according to the Bureau of Labor Statistics. In December 2017 it was 246.524. That means consumer prices are 36.9% higher than at Bitcoin’s 2017 peak, and a dollar from that month now buys 27% less.
Since November 2021, prices have risen 21.4%, cutting the dollar’s buying power by 17.6%. The largest single-year jump came in 2022, and our coverage of the October inflation report showed price pressure has not fully faded.
Those percentages matter for anyone comparing today’s Bitcoin price with old highs. A nominal chart treats a 2017 dollar and a 2026 dollar as equal. They are not.
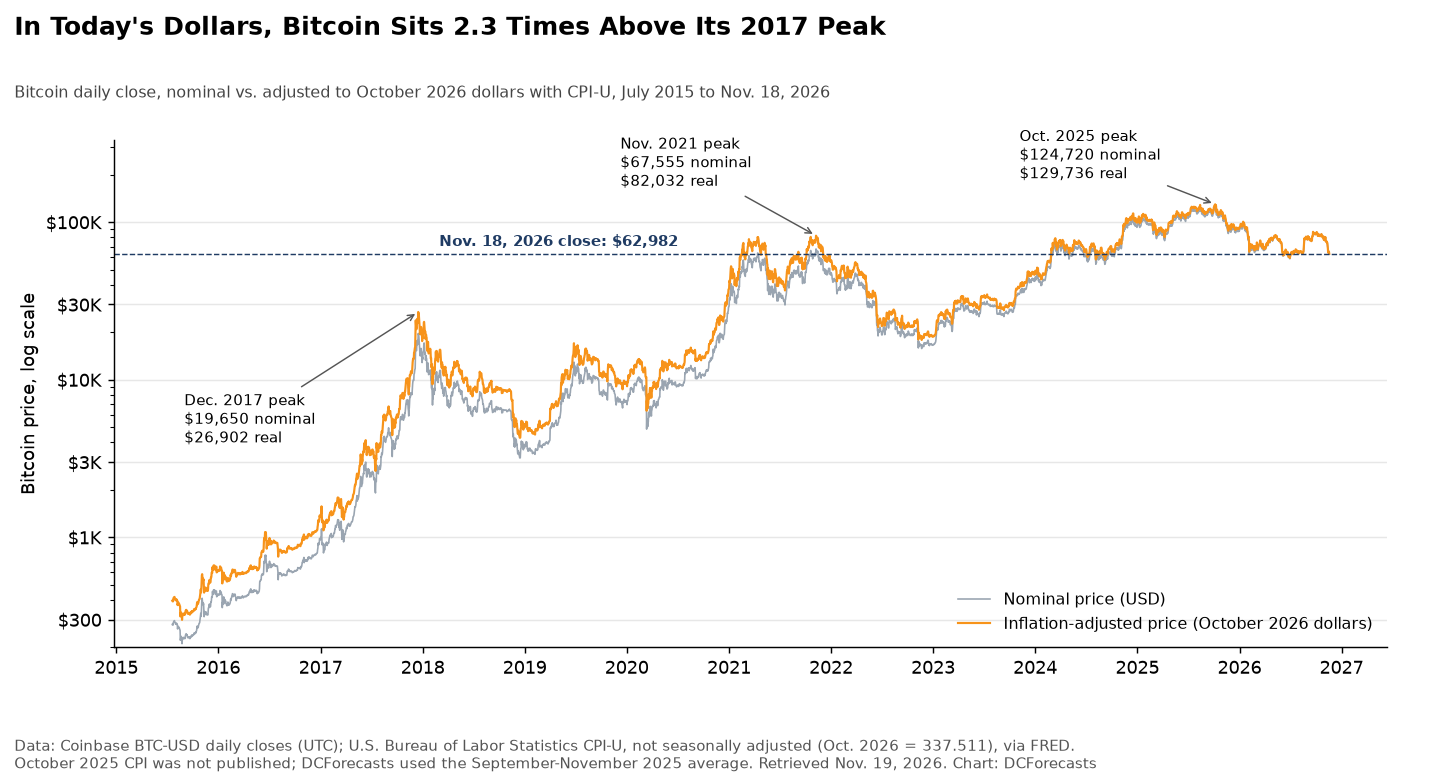
Bitcoin’s Inflation-Adjusted Price Against Each Cycle
The adjustment flatters Bitcoin when measured against the 2017 and 2018 markets. The December 2018 bear market low of $3,183 equals $4,276 in today’s money. Bitcoin now trades 14.7 times above that level in real terms.
The November 2022 low of $15,760.14 equals $17,867 today. Even after this year’s decline, Bitcoin is 3.5 times higher than that low after inflation, compared with 4.0 times in nominal terms.
The adjustment is less kind to the 2021 high. Bitcoin’s Nov. 8, 2021 close of $67,554.84 is worth $82,032 in October 2026 dollars. On a nominal chart, Bitcoin sits just 6.8% below that peak. In real terms, it is 23.2% below.

The October 2025 record changes the least because it is so recent. The $124,720.09 close on Oct. 6, 2025 equals $129,736 today, so the real drawdown from that peak is 51.5%, compared with 49.5% in nominal terms. Our cycle check tracks how that decline compares with past bear markets.
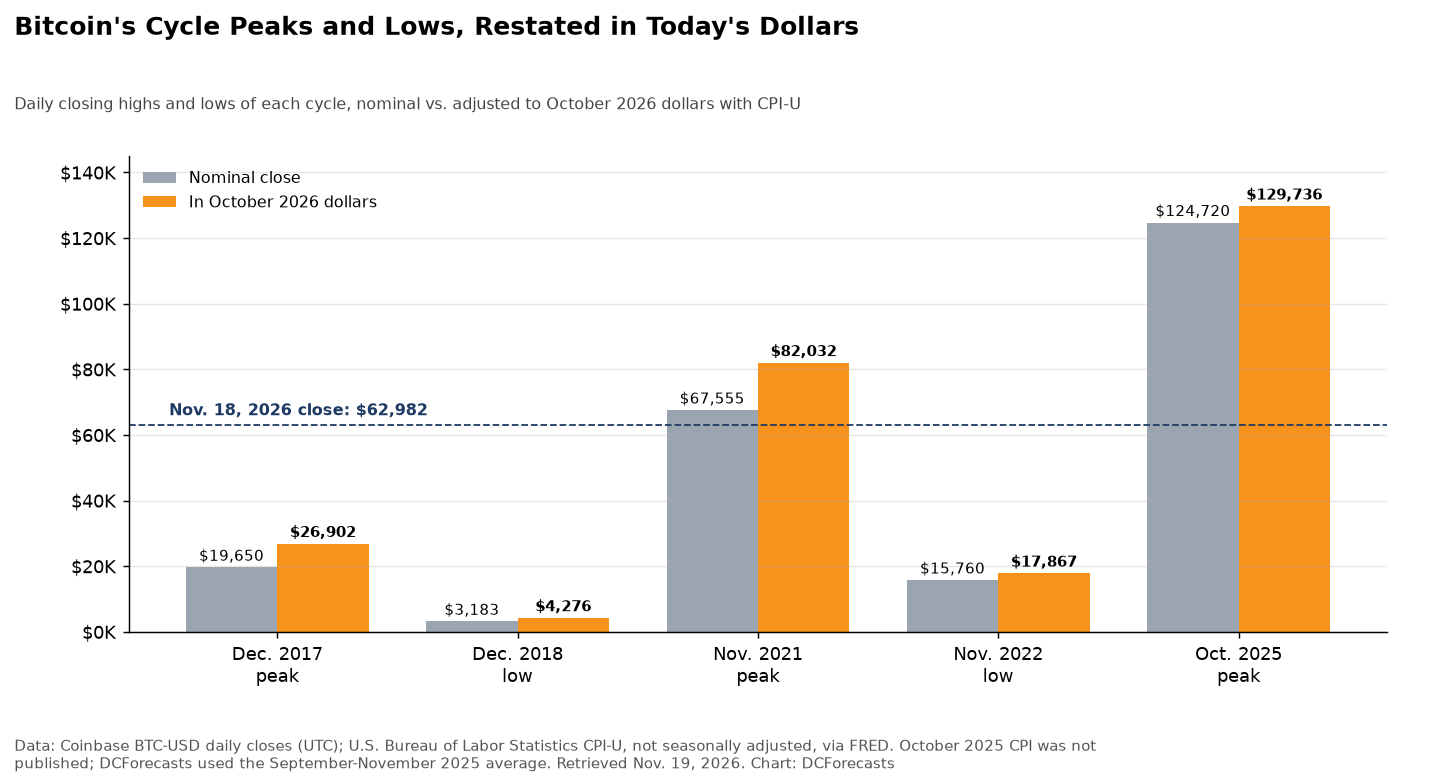
Today’s Real Price Still Ranks High in Bitcoin’s History
One way to judge the current level is to ask how often Bitcoin has been more expensive in real terms. Across 4,140 daily closes since July 20, 2015, the inflation-adjusted price was higher than today on just 1,085 days, or 26.2% of the time.
In other words, even during one of the sharpest sell-offs of this cycle, Bitcoin trades above its real price on roughly three of every four days in its Coinbase history.
The long-run return also holds up after inflation. Bitcoin’s first Coinbase daily close was $280 on July 20, 2015, or about $396 in today’s dollars. From there to Nov. 18, 2026, Bitcoin compounded at 61.3% a year in nominal terms and 56.4% a year after inflation, over more than 11 years.
Inflation took about five percentage points a year off the nominal figure. That is a meaningful bite, but it barely dents a return of that size. Our study of four-year Bitcoin holding periods found a similar pattern of patient holders being rewarded.
What Inflation Means for the Bitcoin Thesis
The comparison goes to the heart of why many investors hold Bitcoin. Its supply is capped at 21 million coins, and new issuance falls by half roughly every four years. The dollar has no such limit, and its buying power erodes every year that prices rise.
That gap shows up in the numbers above. Over the period studied, the dollar lost 29.3% of its purchasing power, while Bitcoin’s real price rose more than 150-fold. As we noted in our look at U.S. debt growth against Bitcoin’s supply, the two monetary systems are moving on very different paths.
The data also carries a caution. Bitcoin does not track inflation month to month. Prices rose 21.4% after the 2021 peak, yet Bitcoin’s real value fell sharply over the following year. Its hedge against a weaker dollar has worked over full cycles, not over short windows.
Why the Real Chart Matters Now
Inflation-adjusted charts help separate noise from progress. In nominal terms, Bitcoin looks close to where it was five years ago. In real terms, it is still below its 2021 high, but far above every cycle low and every peak before 2021.
Each bear market low has also come in higher in real terms than the last: $4,276 in 2018 and $17,867 in 2022, in today’s money. Whether the current cycle continues that pattern is not yet known, but Bitcoin would have to fall more than 70% from here to break it.
With momentum gauges deeply oversold, the inflation-adjusted record offers useful perspective. Bitcoin has spent most of its history below today’s real price, and holders who looked through past downturns have been paid well above the rate of inflation.
DC Forecasts is a leader in many crypto news categories, striving for the highest journalistic standards and abiding by a strict set of editorial policies. If you are interested to offer your expertise or contribute to our news website, feel free to contact us at [email protected]












Discussion about this post