



Bitcoin December history carries a simple message this year: the last month of the year has tended to follow November’s lead, and November 2026 has been rough.
Bitcoin closed at $62,987 on Nov. 18, down 18.7% from its Oct. 31 close of $77,435, according to Yahoo Finance daily data. Coinbase spot was near $62,000 early on Nov. 20.
We went back through every November and December since 2014 to see how often the two months agree, and what tended to happen after the red ones.
The short answer is that the pattern is sticky. The more useful answer is in how December losses have shrunk, and where some of Bitcoin’s biggest floors were set.
How Often Does Bitcoin’s December Match November?
In 10 of the 12 years from 2014 to 2025, December finished in the same direction as November. Strong Novembers usually led to green Decembers, and weak ones led to red Decembers.
The two exceptions both broke the bullish side of the pattern. November 2014 gained 11.7% before December lost 15.3%, and November 2024 rose 37.4% before December slipped 3.1%.
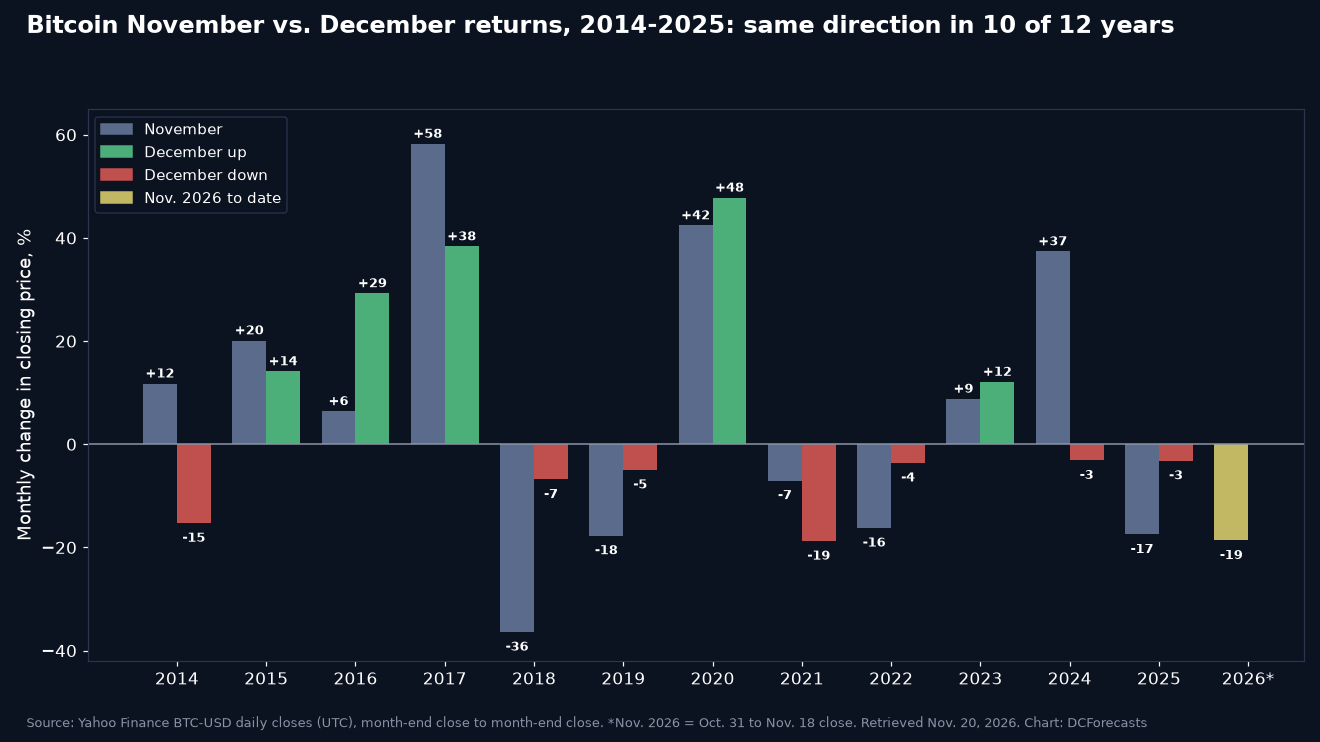
On the red side, the record is unbroken in this data set. Bitcoin had five losing Novembers, in 2018, 2019, 2021, 2022 and 2025, and each one was followed by a losing December.
That is worth stating plainly, because it argues for patience rather than a quick V-shaped bounce into the new year.
December Losses Have Been Much Smaller Than November’s
The size of those December declines tells a more encouraging story. Across the five red Novembers, Bitcoin lost an average of 19.0%. The Decembers that followed lost an average of 7.5%.

In four of the five cases, December’s drop was smaller than November’s. The exception was 2021, when a 7.0% November slide was followed by an 18.8% December decline as the last bull cycle rolled over.
The most recent examples are milder still. December 2022 fell 3.6%, December 2024 fell 3.1% and December 2025 fell 3.2%.
In other words, the last three red Decembers each lost less than 4%. Selling pressure has tended to fade into year-end rather than accelerate.
Across all 12 Decembers, the month rose five times. The average December return was a gain of 7.1%, lifted by big rallies in 2017 and 2020, while the median was a loss of about 3.2%.
Where Bitcoin Bear Market Floors Formed
Late November and December have also hosted two of Bitcoin’s most important lows.
The lowest daily close of the 2018 bear market came on Dec. 15, 2018, at $3,237. Bitcoin did not close lower at any point in 2019.
Four years later, the lowest close of the 2022 bear market arrived on Nov. 21, 2022, at $15,787, after the FTX collapse. December 2022 then slipped just 3.6% without taking out that level.
We are not suggesting that a calendar month creates a bottom. Floors form when sellers run out of coins to sell, and seasonality is only a loose guide.
Still, it is notable that two of the last three cycle lows were set during the same stretch Bitcoin is moving through now. We looked at the broader cycle timing in our Bitcoin cycle check on this November’s slide.
What Followed Red Novembers Over 12 Months
A single month says little about where Bitcoin goes next. So we also measured the price change from each red November’s closing price to the close 12 months later.
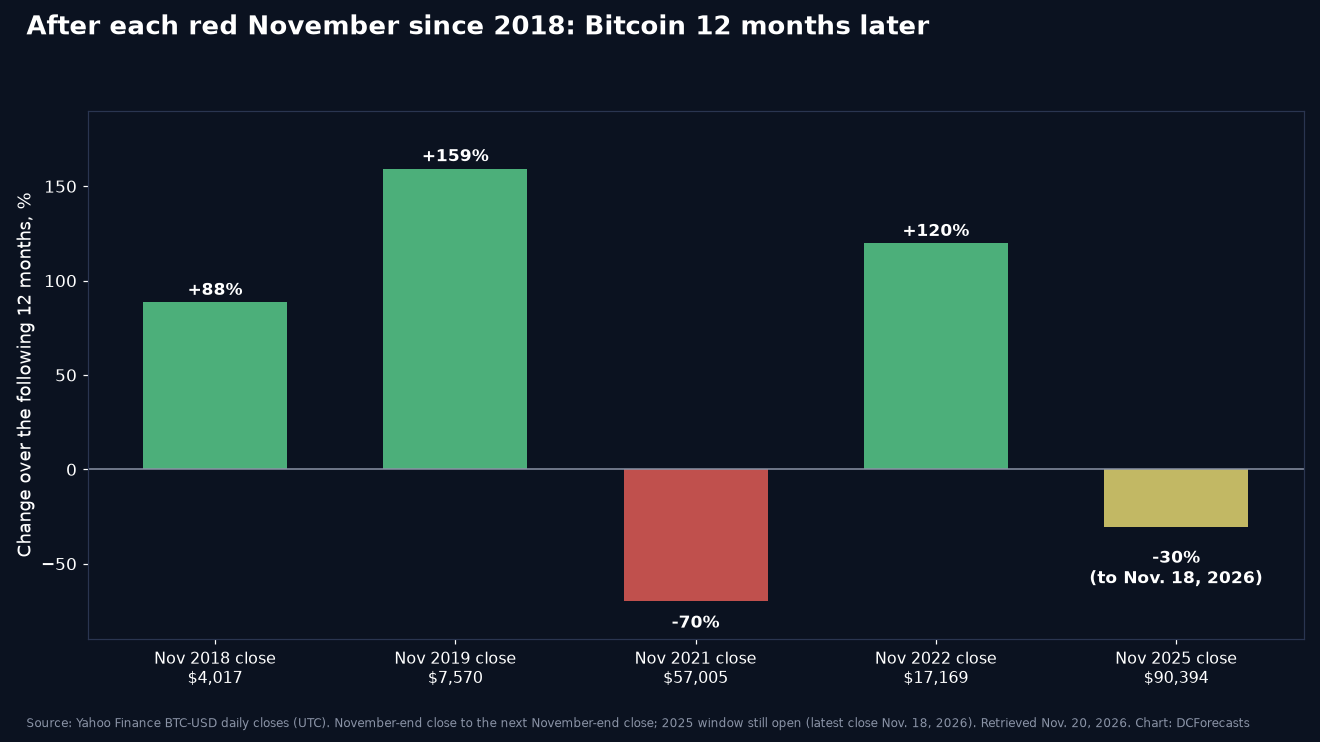
Three of the four completed windows ended sharply higher. Bitcoin rose 88% from the November 2018 close of $4,017, 159% from the November 2019 close of $7,570 and 120% from the November 2022 close of $17,169.
The exception was November 2021, which came right after the cycle peak. Bitcoin went on to lose 70% over the next year, ending November 2022 at $17,169.
The 2025 window remains open. From the November 2025 close of $90,394, Bitcoin is down 30.3% as of Nov. 18, 2026, with about two weeks left to run.
That matters for context. This is Bitcoin’s second red November in a row, which has happened twice before, in 2018 and 2019 and again in 2021 and 2022. Both times, the second red November was followed by a strong year: up 159% after 2019 and 120% after 2022.
What This Bitcoin December Pattern Means for Investors
We believe the evidence supports two ideas at once.
First, history does not point to an easy December. A red November has never been followed by a green December in Yahoo’s data, so a choppy or slightly lower month would be consistent with the record.
Second, the damage has usually been limited. December losses after red Novembers have averaged well under half of November’s, and the last three red Decembers stayed within 4%.
For long-term holders, the more important signal sits further out. In three of four completed cases, the year after a red November rewarded buyers who looked past the year-end weakness. Our Thanksgiving week price history showed a similar split between short-term noise and the following 90 days.
Twelve Decembers is a small sample, and macro conditions differ each year. Past seasonality does not guarantee future returns.
But if Bitcoin follows its own record, December may be less about a dramatic recovery and more about selling pressure running thin, which is often how durable bases have started.
DC Forecasts is a leader in many crypto news categories, striving for the highest journalistic standards and abiding by a strict set of editorial policies. If you are interested to offer your expertise or contribute to our news website, feel free to contact us at [email protected]












Discussion about this post