


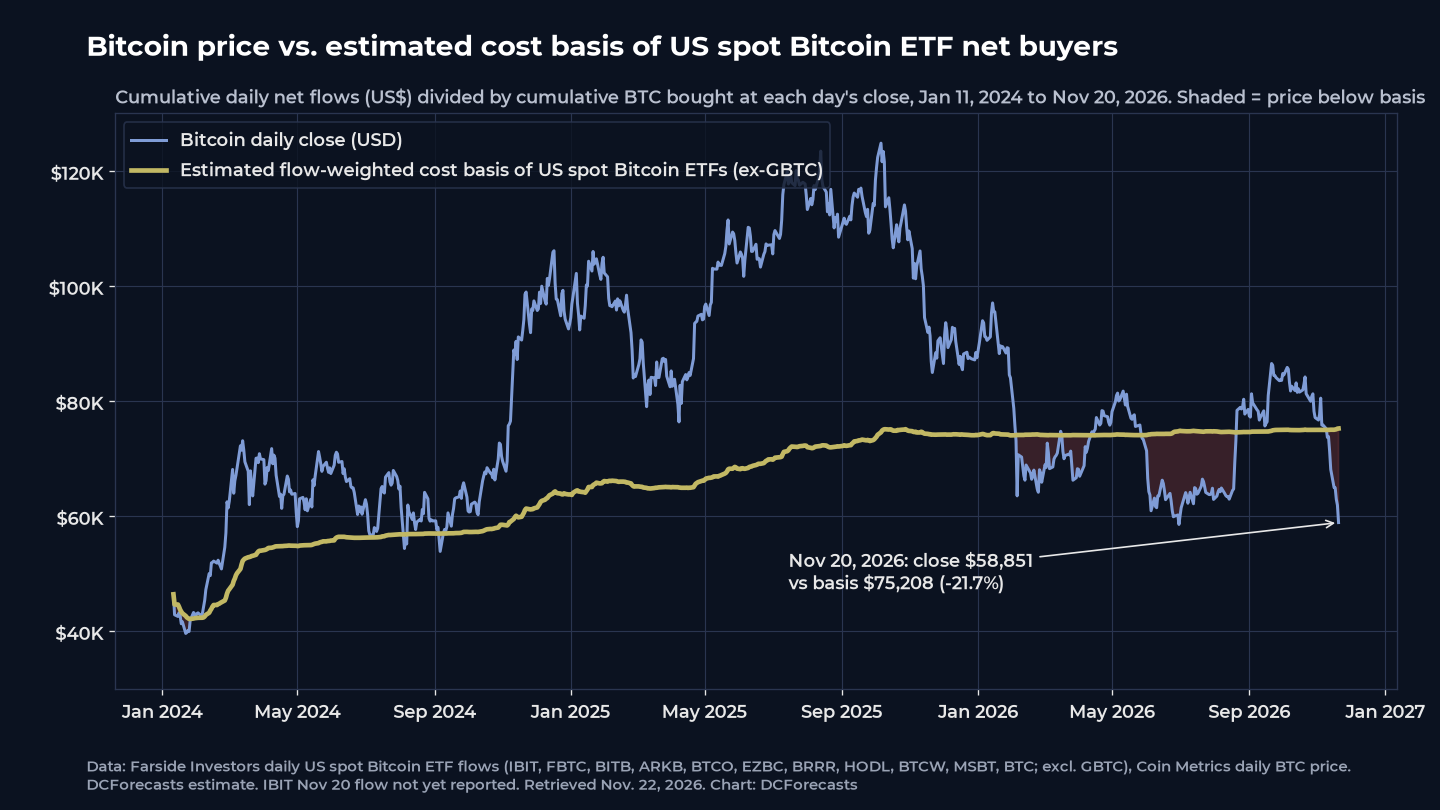
The Bitcoin ETF cost basis, by our estimate, sits near $75,200 per coin, and Friday’s close left the average US spot ETF buyer further below that level than at any point since the funds launched in January 2024.
Bitcoin closed at $58,851 on Nov. 20, according to Coin Metrics, about 21.7% below that estimated average entry. It traded near $60,900 on Sunday afternoon, after a Saturday close of $60,123, still about 19% below that level.
That sounds like a recipe for panic selling. The flow data says otherwise.
For Bitcoin investors, the more telling number is how few coins have actually left. We estimate the newer spot ETFs still hold roughly 94% of the bitcoin they had built up at their May peak.
The bigger question now is whether these holders behave as they did the last time the gap opened this wide.
How We Estimated the Bitcoin ETF Cost Basis
Farside Investors publishes daily net flows in US dollars for every US spot Bitcoin ETF. We took each day’s flow from Jan. 11, 2024 to Nov. 20, 2026 and divided it by that day’s Bitcoin close from Coin Metrics.
That converts dollars into an approximate number of coins bought or sold. Dividing total net dollars by total net coins gives a flow-weighted average cost.
We left out Grayscale’s GBTC, which converted from an older trust and holds coins that were never bought through these flows. Its net outflows since conversion total $28.27 billion, per Farside.
The remaining 11 funds, led by BlackRock’s IBIT and Fidelity’s FBTC, took in $81.72 billion of net inflows. That works out to about 1.087 million BTC at an average of roughly $75,208.

This is an estimate, not a reported figure. It ignores management fees and the small timing differences between creations and the daily close. Farside’s table had also not yet posted IBIT’s Nov. 20 flow when we retrieved it.
A cross-check suggests the method holds up. iShares data shows IBIT had 1,360,960,000 shares outstanding on Nov. 20, with 22.63 BTC per 40,000-share basket. That implies about 769,960 BTC in the trust, within 0.6% of our flow-based estimate of 774,085 BTC.
A Record Gap, but Not a Rush for the Exit
The basis barely moved this year. It stood near $74,050 at the end of 2025 and has crept up only about $1,150 since.
That is because 2026 flows into these funds have been close to flat. From Jan. 1 to Nov. 20 they recorded about $125 million of net outflows, a rounding error next to $81.7 billion of cumulative inflows.
From Feb. 1 onward, they actually took in a net $1.03 billion, even though Bitcoin closed below the estimated basis on 112 of this year’s 224 trading days.
November has been the hardest test. The 11 funds have lost about $3.37 billion so far this month, or roughly 48,300 BTC by our estimate. As we covered when IBIT’s outflow streak reached 11 days, even the largest fund has been giving back only a small share of what it gathered.
We believe that matters more than the headline outflows. Holders sitting on a 20%-plus paper loss who mostly stay put are not behaving like weak hands.
What Happened the Last Time Buyers Were This Far Underwater?
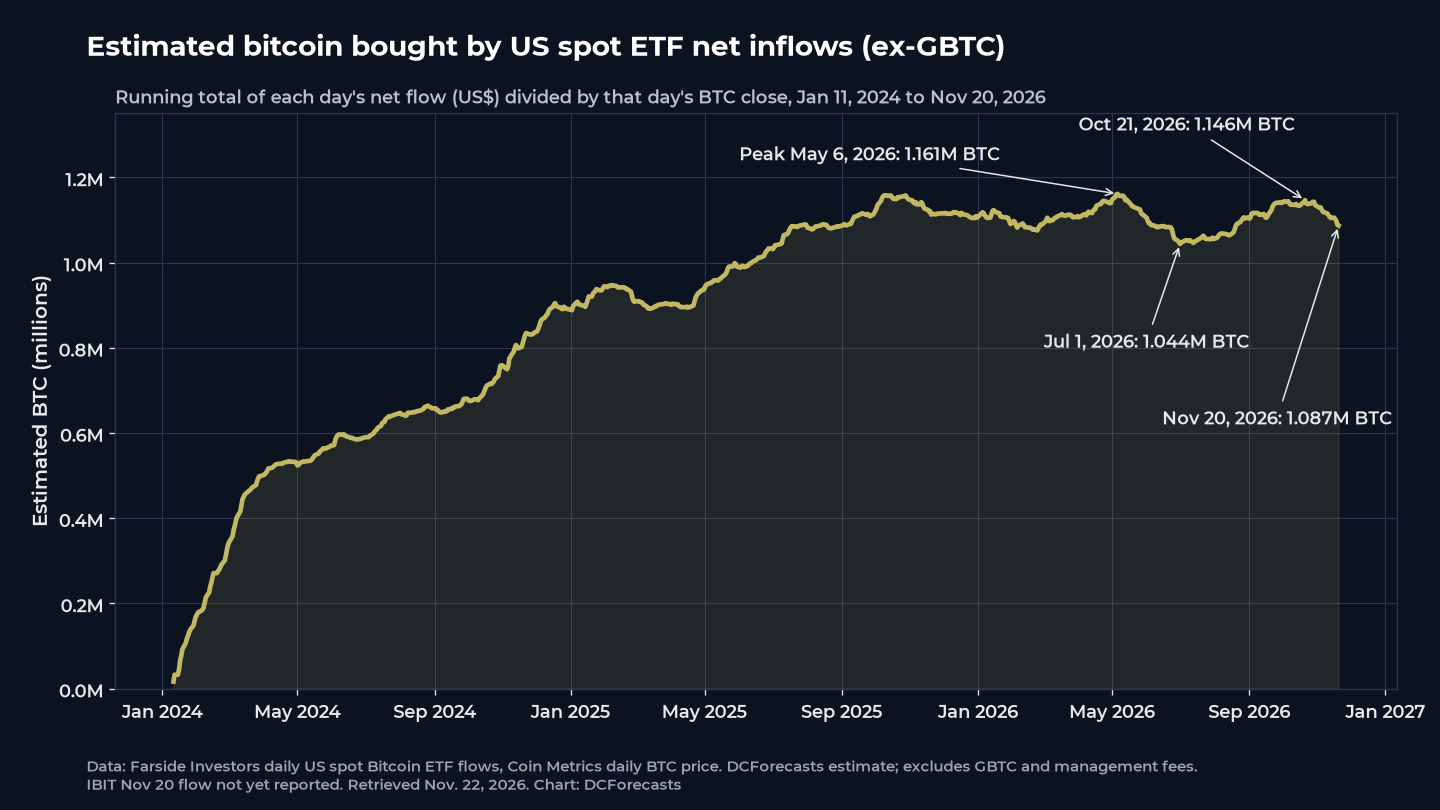
The closest precedent came this summer. On July 1, Bitcoin closed at $60,066, about 20% below the estimated basis, and our running coin estimate hit a low of 1.044 million BTC.
What followed was a reload, not a retreat. Between July 2 and Oct. 21, the funds added about $7.9 billion of net inflows, lifting the estimate to 1.146 million BTC. Bitcoin closed at $84,176 on Oct. 21.
One episode does not make a rule, and today’s macro backdrop is tougher. Still, it shows that ETF demand has returned quickly after earlier periods below cost.
Why the Spot Bitcoin ETF Coin Count Matters
The estimated coin count peaked at about 1.161 million BTC on May 6. At 1.087 million now, it is down about 74,400 BTC, or 6.4%.
Bitcoin’s price, by contrast, is down about 53% from its record close of $124,824 on Oct. 6, 2025, per Coin Metrics. Investors have sold far less than the market has fallen.
That fits what on-chain data has been showing. Our look at Bitcoin’s realized price near $53,762 showed the network’s average coin still in profit, and the price remains above that level even as the ETF cohort sits in the red.
For us, the key takeaway is that the ETF wrapper has not turned into a source of forced selling. We suspect that reflects who uses these funds: investors who chose a regulated, long-term wrapper rather than a trading account.
What Could Turn Bitcoin ETF Flows Back Up?
We would watch three things in the weeks ahead.
- Daily Bitcoin ETF flows, especially whether IBIT returns to net creations after this month’s redemptions.
- The gap between price and the roughly $75,200 basis. A move back above it would need about a 23.5% gain from Sunday’s level near $60,900.
- The estimated coin count. Holding above the July low of 1.044 million BTC would keep this drawdown shallower than the summer one.
None of these guarantees a rebound. Prices can stay below an average cost for months. Bitcoin closed under the estimated basis on 44 of 62 trading days from February through April.
But the structure behind US spot Bitcoin ETFs looks sturdier than the price chart suggests. Roughly $81.7 billion of net money is still in the newer funds, Bitcoin’s supply remains capped at 21 million, and most holders have chosen to wait rather than sell.
If Bitcoin reclaims the ETF cost basis, the investors who held through a record discount may be the ones who benefit most.
DC Forecasts is a leader in many crypto news categories, striving for the highest journalistic standards and abiding by a strict set of editorial policies. If you are interested to offer your expertise or contribute to our news website, feel free to contact us at [email protected]












Discussion about this post