



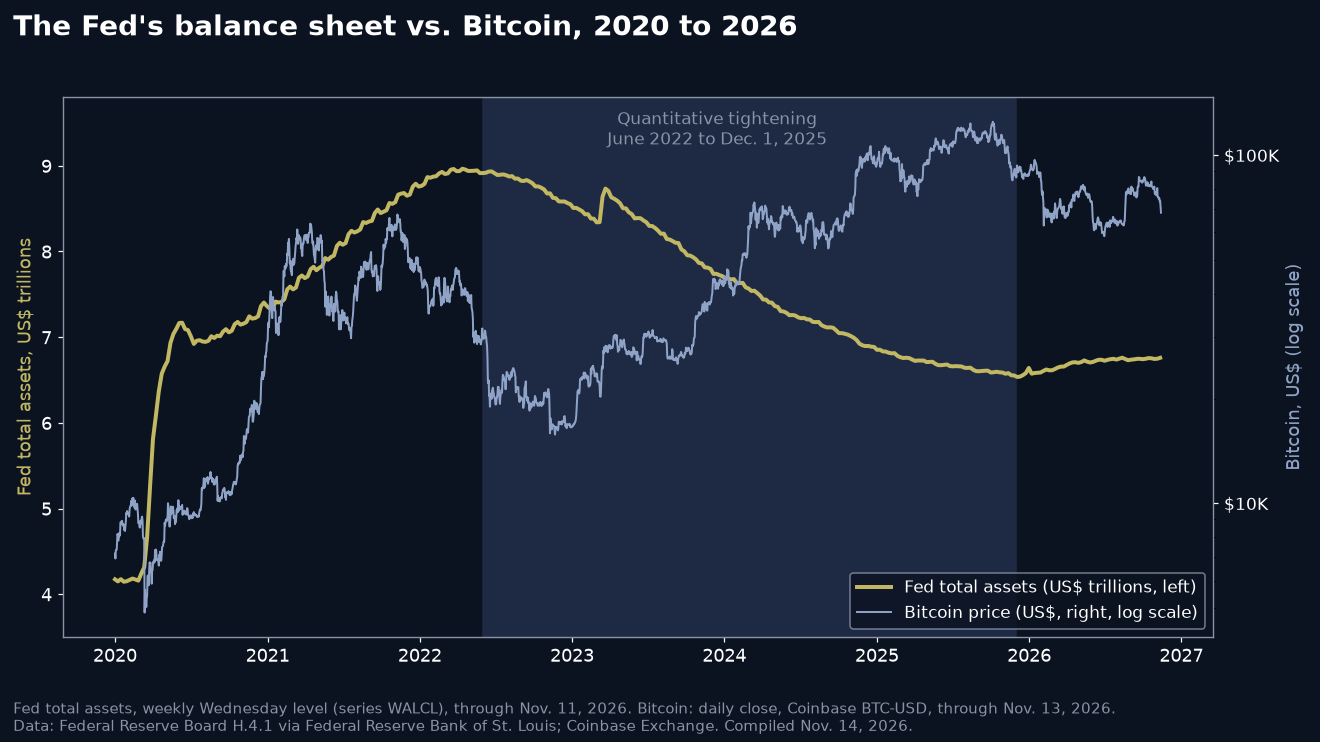
Quantitative tightening was supposed to be the worst possible backdrop for Bitcoin. Between June 2022 and December 2025, the Federal Reserve shrank its balance sheet by $2.38 trillion, pulling liquidity out of the financial system week after week.
Bitcoin more than tripled anyway. Its Coinbase closing price went from $29,789 on June 1, 2022, to $93,454 on Dec. 3, 2025, the first weekly balance sheet reading after QT ended. That is a gain of 213.7% while the Fed’s assets fell 26.7%.
Now the Fed is growing its balance sheet again, and Bitcoin has gone the other way. Here is what the weekly data shows, and why the relationship is looser than the “liquidity drives everything” story suggests.
The Fed Stopped Shrinking on Dec. 1, 2025
The Federal Open Market Committee announced in October 2025 that it would “conclude the reduction of its aggregate securities holdings on December 1.” At its next meeting, the Fed’s December implementation note went further, directing the New York Fed to increase holdings “through purchases of Treasury bills” to maintain an ample level of reserves, and to reinvest all agency mortgage paydowns into bills.
The effect shows up clearly in the Fed’s weekly H.4.1 release. Total assets bottomed at $6.536 trillion on Dec. 3, 2025. By Nov. 11, 2026, they had climbed to $6.759 trillion, an increase of $223 billion, or 3.4%.
That is modest next to the 2020 expansion, when the balance sheet nearly doubled. But it is the first sustained growth since total assets peaked at $8.965 trillion in April 2022.
Bitcoin’s Best Stretch Came During QT
The chart above breaks the simple link many traders assume. In 2020 and 2021, Bitcoin and the Fed’s balance sheet rose together, and the pairing became a market shorthand. Then the two split.
Bitcoin bottomed near $15,760 in November 2022, roughly six months into QT, and went on to a record close of $124,720 on Oct. 6, 2025. The Fed was still shrinking its holdings during that entire run.
The lesson is that Bitcoin’s demand did not depend on central bank asset purchases. A shrinking Fed was a headwind, not a ceiling. Investors who waited for a liquidity “pivot” before buying missed most of the cycle. By the time QT formally ended, Bitcoin had already set its all-time high.

Since QT Ended, the Pattern Has Flipped
The more recent period cuts the other way. Since the Dec. 3, 2025 reading, the Fed’s balance sheet has grown 3.4%, while Bitcoin’s Coinbase close has fallen 26.8%, to $68,370 on Nov. 13, 2026.
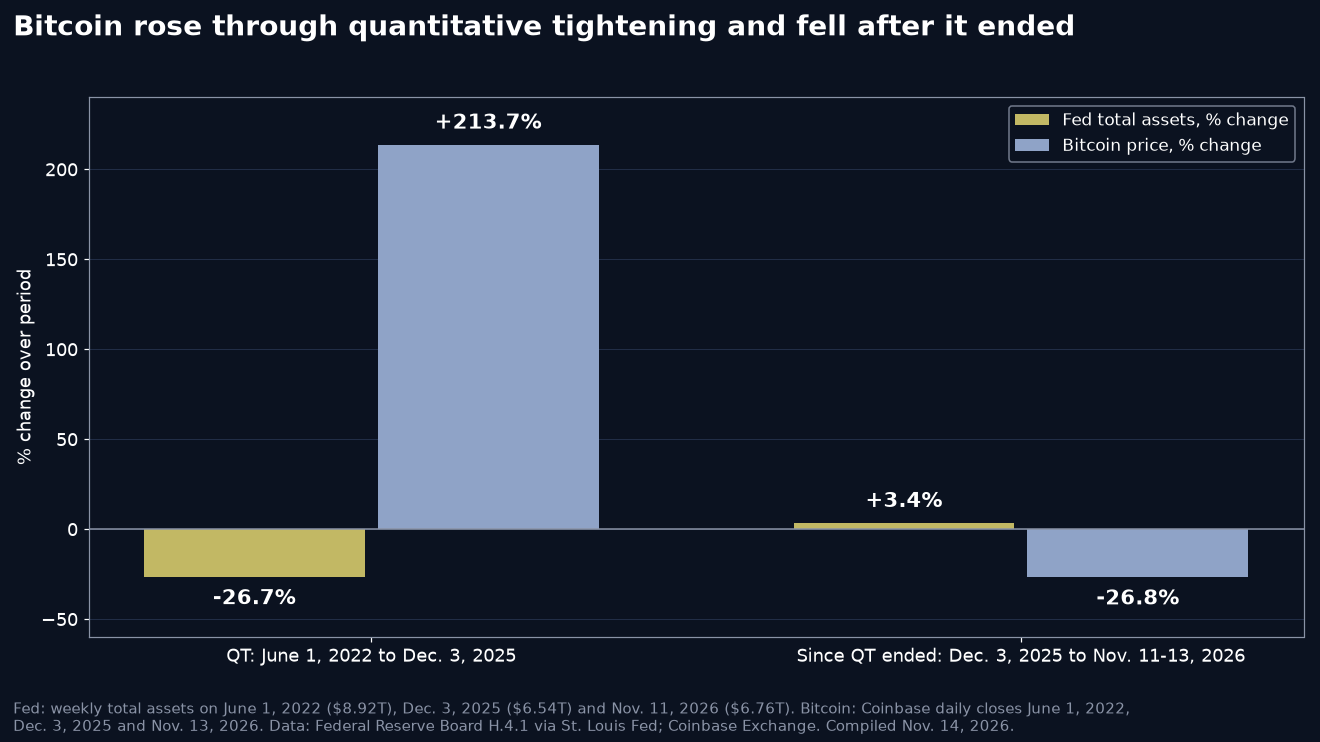
That does not mean liquidity has turned negative for Bitcoin. It means the Fed’s balance sheet is one input among several, and over a period of 11 months it can easily be swamped by positioning, leverage and the four-year cycle. DCForecasts’ cycle drawdown analysis shows that this pullback, at about 45% from the peak, is still shallower than the 75%-plus declines of the last two cycles.
Where the Liquidity Is Going
Two other lines in the Fed data explain why the plumbing looks different this time. Both come from the same weekly release, and both moved more than the headline total.
First, bank reserves. Reserve balances at Federal Reserve banks were $2.858 trillion in the week of Dec. 3, 2025, and $2.961 trillion in the week to Nov. 11, 2026. That is about $102 billion more, so close to half of the balance sheet growth has landed as reserves in the banking system.
Second, the overnight reverse repo facility. At the end of 2022, money market funds and others parked $2.55 trillion there. On Nov. 13, 2026, the facility held $0.325 billion. That buffer, which absorbed much of the excess cash during QT, is effectively empty.
With the reverse repo cushion gone, further Fed bill purchases are more likely to show up directly in reserves and short-term funding markets rather than sitting idle at the central bank. That is a structural change from the past three years, even if its effect on asset prices takes time to appear.
What This Means for Bitcoin Holders
The balance sheet is no longer shrinking, the reverse repo buffer has drained, and reserves are rising again. Together, those shifts remove one of the headwinds Bitcoin faced through the last cycle, a cycle in which it still tripled.
Price is a separate question. Bitcoin is trading just above its 200-week moving average, a long-term average that has not declined once since 2019. That support, combined with a Fed that has stopped draining the system, gives long-term holders a firmer floor than they had in 2022.
What the data does not support is the idea that a growing Fed balance sheet guarantees higher prices. The last four years showed that Bitcoin can rally without the Fed and fall while the Fed expands. Liquidity sets the tide; it does not steer every wave.
Data to Watch
- The weekly H.4.1 release each Thursday, especially the pace of Treasury bill holdings.
- Reserve balances, which now take most of any new Fed liquidity.
- The overnight reverse repo facility, which would signal excess cash if it starts filling again.
DC Forecasts is a leader in many crypto news categories, striving for the highest journalistic standards and abiding by a strict set of editorial policies. If you are interested to offer your expertise or contribute to our news website, feel free to contact us at [email protected]












Discussion about this post