



The Bitcoin RSI has fallen to about 20, one of the most stretched momentum readings the market has printed in a decade.
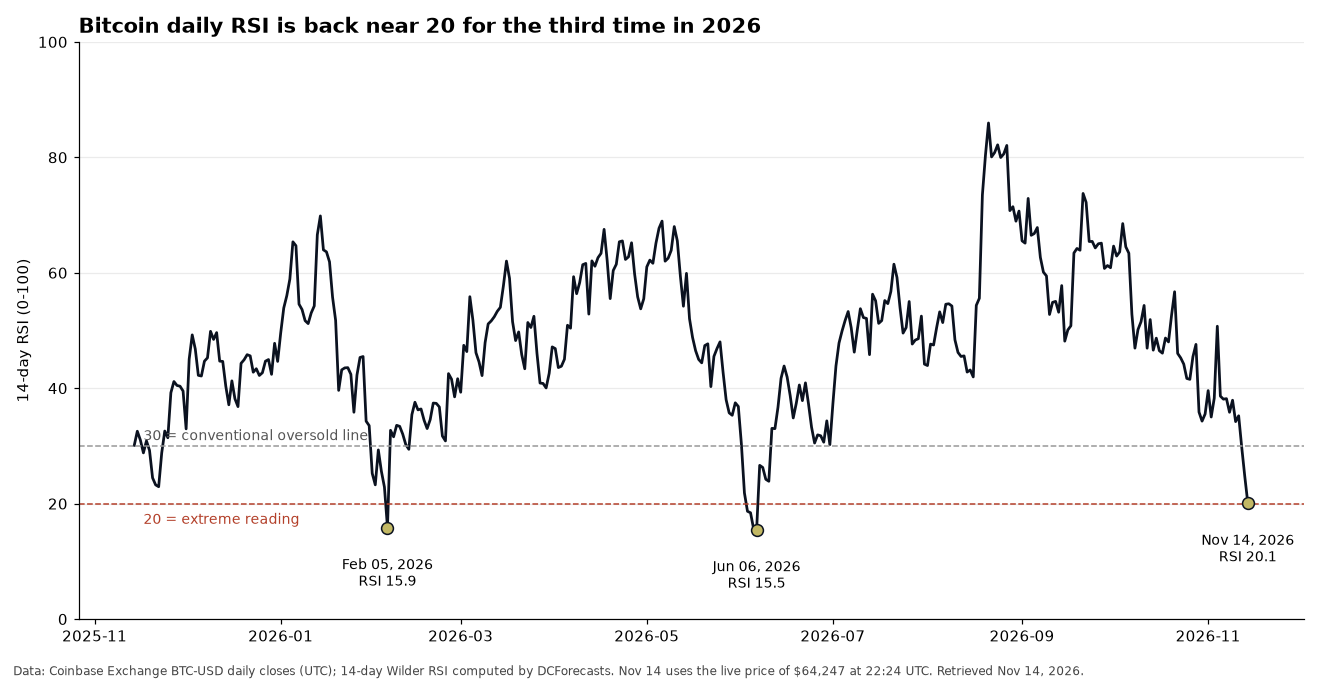
At 22:24 UTC on Nov. 14, Bitcoin traded at $64,247 on Coinbase Exchange. That left the 14-day relative strength index on the daily chart at 20.1, down from 24.7 a day earlier and 35.8 at the Nov. 8 close.
It is the lowest reading since June 6, 2026, and only the third time this year the gauge has reached this zone.
For Bitcoin investors, the useful part is not the number itself. It is what happened the last few times momentum was crushed this hard.
The bigger question now is whether a selling streak this one-sided is closer to its end than its beginning.
How Deep Is the Bitcoin RSI Slide?
The RSI compares the size of recent up days with recent down days on a scale from 0 to 100.
Readings under 30 are usually described as oversold. Readings near 20 are rare, because they require almost uninterrupted selling for two weeks.
That is what Bitcoin has delivered. The price is down 17% from its Oct. 31 close of $77,424, and it now sits about 5.2% below the 200-week moving average of roughly $67,754.
As we noted when that long-term average reached a record $67,754, the level has often acted as a floor in past cycles. Trading below it is uncomfortable, but it is also where long-horizon buyers have historically shown up.

Is Bitcoin Oversold Enough to Matter?
We went back through Coinbase daily closes from 2016 onward to answer that.
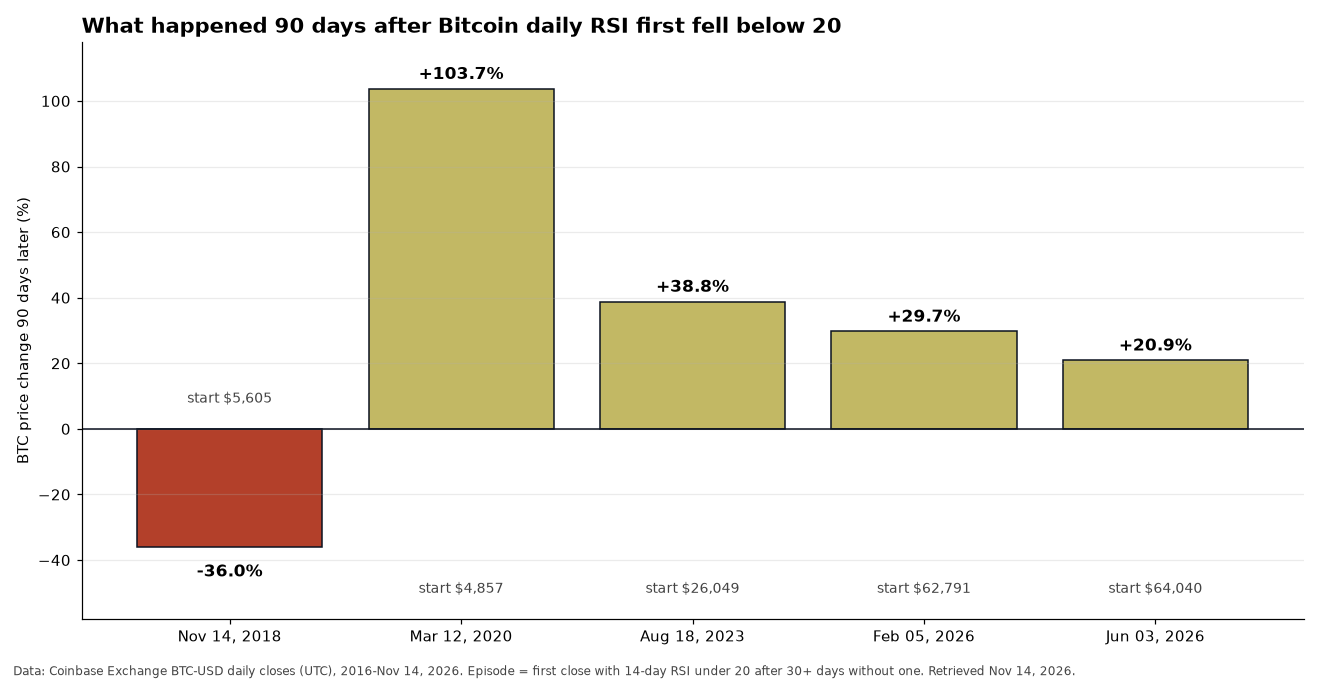
In that period, Bitcoin closed with a daily RSI below 20 on just 21 days. Grouped into separate episodes, with at least 30 days between them, that makes five events.
Here is how each played out 90 days after the first close below 20:
- Nov. 14, 2018, at $5,605: down 36.0%, as the 2018 bear market made its final low weeks later.
- March 12, 2020, at $4,857: up 103.7% after the pandemic crash.
- Aug. 18, 2023, at $26,049: up 38.8%.
- Feb. 5, 2026, at $62,791: up 29.7%.
- June 3, 2026, at $64,040: up 20.9%.
Four of five were higher three months later. The median 90-day change was a gain of 29.7%.
What the Exceptions Teach Us
The 2018 case is the honest warning. An extreme RSI did not mark the bottom that time, and Bitcoin fell another 43% at its worst within 90 days.
Yet even that episode looked very different with patience. One year after Nov. 14, 2018, Bitcoin was 54% higher.
The two 2026 signals carry their own lesson. Both produced strong rallies, but neither turned into a lasting trend. The June 3 starting price of $64,040 is almost exactly where Bitcoin trades today.
We believe that tells traders something important. An oversold reading has been a reliable sign that sellers are exhausted for now. It has not been a promise that a new bull phase starts the next day.
With only five episodes, the sample is small. Nothing here guarantees a repeat.
What Should BTC RSI Watchers Track Next?
A low momentum reading works best when other data starts to confirm it. We would watch three things.
First, the weekly chart. Bitcoin’s weekly RSI is provisionally 37.8 for the week ending Nov. 15, down from 47.9 a week earlier. The deepest weekly reading of the 2022 bear market was about 25.7 in early July 2022, so this market is not at that extreme.
Second, the year’s floor. The lowest 2026 close was $58,524 on June 30, and Bitcoin remains about 9.8% above it. Holding that level would keep this year’s range intact.
Third, leverage. As we covered in our look at Bitcoin funding rates, futures traders have not been paying up to stay long. A flush driven by spot selling rather than crowded leverage can leave the market cleaner on the other side.
Why We Still See This as a Reset
Bitcoin is about 48.5% below its record close of $124,720 from Oct. 6, 2025. That is a deep drawdown, and we will not pretend otherwise.
Our cycle comparison showed that past Bitcoin bear markets went deeper than this one has so far, while the network’s fixed supply schedule and growing institutional rails remain unchanged.
For us, the key takeaway is that sellers have pushed momentum to a level where they have usually run out of fuel. In four of the last five cases, buyers who stepped in at this kind of reading were rewarded within three months.
A daily close back above the 200-week average near $67,754 would be the first sign that the rebound is real. The coming days will reveal whether this sell-off becomes another entry point for long-term holders.
DC Forecasts is a leader in many crypto news categories, striving for the highest journalistic standards and abiding by a strict set of editorial policies. If you are interested to offer your expertise or contribute to our news website, feel free to contact us at [email protected]












Discussion about this post