



Bitcoin monthly returns rarely look this lopsided halfway through November.
Near 23:00 UTC on Nov. 14, Bitcoin traded around $63,650 on Coinbase Exchange. That is 17.8% below the Oct. 31 close of $77,424, and it leaves the first 14 days of this November as the second weakest since at least 2015.
Only one year opened the month worse. In 2022, Bitcoin fell 19.0% from Oct. 31 to Nov. 14.
That November went on to print the lowest daily close of the entire 2022 bear market, $15,760 on Nov. 21. Bitcoin never closed lower again.
History does not repeat on schedule. But the record of every November since 2015 says a lot about how much can change in the next two weeks.
How Bad Is This November So Far?
We measured each November from the Oct. 31 daily close to the Nov. 30 daily close, using Coinbase Exchange BTC-USD candles in UTC.
Across the 11 complete Novembers from 2015 to 2025, Bitcoin rose in six and fell in five. The median result was a gain of 6.6%.
The spread is enormous. November 2017 added 53.7%, November 2020 added 42.8% and November 2024 added 37.4%. At the other end, November 2018 lost 36.9%.
This year arrived after a weak October. Bitcoin lost 7.3% that month, following a 4.0% October decline in 2025.

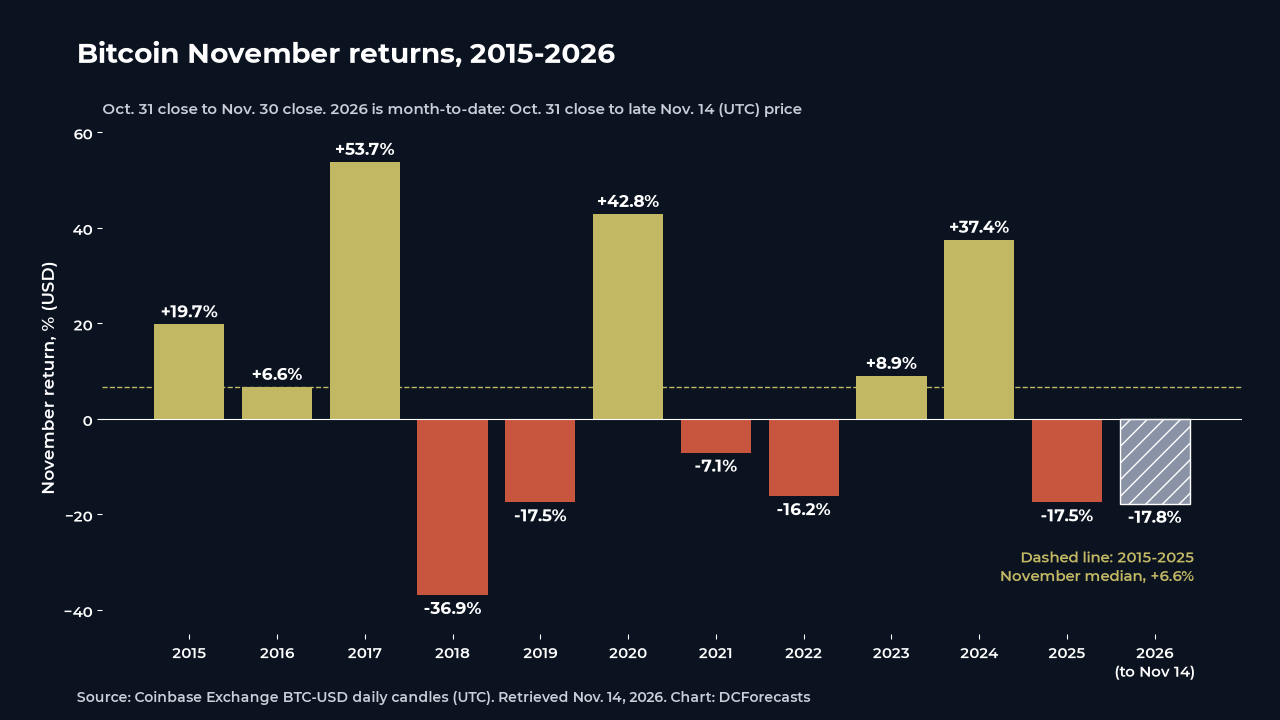
Today’s 17.8% month-to-date drop is already deeper than every full November on record except 2018.
What the Bitcoin Monthly Returns Show About the Second Half
The more useful split is what happened after Nov. 14 in each year.
From the Nov. 14 close to the Nov. 30 close, Bitcoin gained in seven of 11 years. The median second-half move was a rise of 4.9%.
Some of those finishes were dramatic. In 2017, Bitcoin added 49.9% in the back half of November alone. In 2020 it added 22.6%, and in 2015 it added 12.6%.
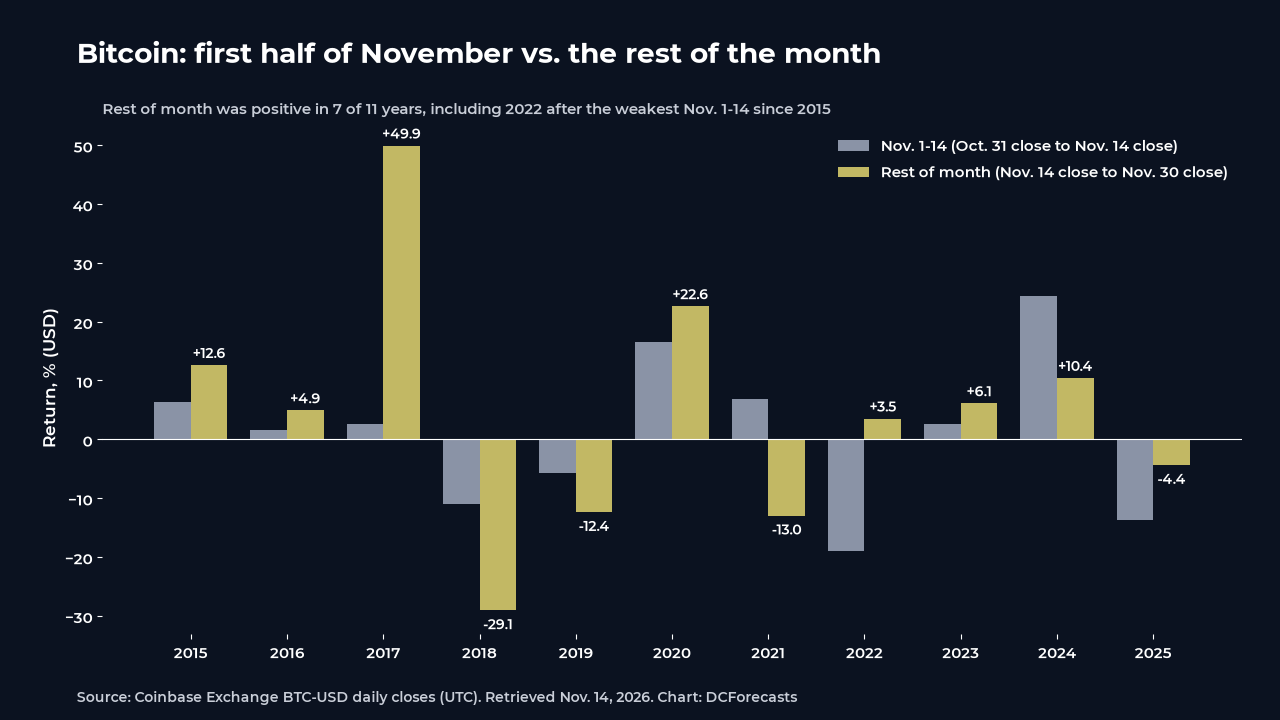
The honest caveat matters here. When November started badly, the rest of the month usually did not rescue it.
Four years began November in the red: 2018, 2019, 2022 and 2025. In three of them, the second half fell further, by 29.1%, 12.4% and 4.4%. Only 2022 turned higher, gaining 3.5% after Nov. 14.
So the data does not promise a quick bounce. What it does show is where those weak Novembers sat in the wider cycle.
Why 2018 and 2022 Stand Out
The two harshest November sell-offs in the record came right before Bitcoin’s bear market floors.
In 2018, the November slide ran into a cycle low close of $3,183 on Dec. 15, less than four weeks after the month ended. That bottom came 364 days after the December 2017 peak close of $19,650.
In 2022, the low arrived inside November itself. The $15,760 close on Nov. 21 came 378 days after the Nov. 8, 2021 peak close of $67,555.
Today, Bitcoin is 404 days past its record close of $124,720 on Oct. 6, 2025. At $63,650, the drawdown is about 49%.
That is far shallower than the 84% and 77% peak-to-trough declines of the last two cycles, a trend we explored when Bitcoin bear market drawdowns shrank across three cycles.
We believe that pattern is one of the more constructive signals in the market right now. Each cycle has needed less damage to reset, as ownership broadened and long-term holders grew.
Bitcoin Historical Returns and the Long Game
A single month is a noisy window. Bitcoin historical returns look very different once the frame widens.
The Oct. 31, 2015 close was $314.85. Even after this month’s slide, Bitcoin is worth roughly 200 times that level.
Momentum is also stretched. As we reported, the Bitcoin RSI neared 20 on Nov. 14, a zone it has reached only a handful of times since 2016.
Price is also hovering just below the 200-week moving average near $67,754, a level long-horizon buyers have historically watched closely.
None of these readings is a timing tool on its own. Together, they describe a market that has already absorbed a heavy, fast sell-off.
What to Watch Before Nov. 30
The first marker is the Oct. 31 close of $77,424. Bitcoin would need to rise about 22% from here to finish November flat, a move only 2017 and 2020 managed in the second half of November since 2015.
A more realistic test is whether the month can end above its Nov. 14 level. In seven of the last 11 years, the Nov. 30 close sat above the Nov. 14 close.
The second marker is the 200-week average. Reclaiming it would put Bitcoin back above a long-term trend line that has not posted a weekly decline since 2019.
The third is the cycle clock. In both 2018 and 2022, the lows set around those weak Novembers were never revisited in the next cycle.
We believe investors who study Bitcoin price history, not just this month’s chart, will see a familiar setup. Painful Novembers have been part of how Bitcoin builds its next base, and the long-run record still favours patient holders.
DC Forecasts is a leader in many crypto news categories, striving for the highest journalistic standards and abiding by a strict set of editorial policies. If you are interested to offer your expertise or contribute to our news website, feel free to contact us at [email protected]












Discussion about this post