


Bitcoin implied volatility is climbing again, and options traders are paying the most for protection over the next few days.
Deribit’s DVOL, a Bitcoin volatility index that tracks the 30-day volatility priced into options, was near 49.4 at 13:48 IST on Nov. 20. It closed at 38.9 on Nov. 11. The last daily close above today’s level was 50.9 on April 2.
The rise comes as BTC trades near $62,000. It closed at $61,913 on Nov. 19, according to Coinbase data, 20% below its Oct. 31 close.
For Bitcoin investors, the useful comparison is Feb. 5. Bitcoin closed at almost the same price that day, $62,791, but DVOL closed at 82.6.
The bigger question is whether this climb is the start of a fear spike, or a measured repricing of risk that the market can absorb.
What Bitcoin Implied Volatility Is Pricing Now
DVOL is calculated from option prices on Deribit, one of the largest crypto options venues. It expresses expected volatility as an annualised percentage.
A reading of 49.4 implies a typical daily move of about 2.6%, or about 14% over 30 days, in either direction. At the Nov. 11 close of 38.9, the same maths gave about 2% a day.
The climb has not been smooth. DVOL briefly touched 54.6 on Nov. 15 before closing that day at 44.0.
Context matters, though. Since September 2023, DVOL has closed above Thursday’s 45.9 on about 58% of days. It averaged 57.7 in 2024 and 46.0 in 2025, and its 2026 low was 33.6 on Sept. 17.

So implied volatility has risen sharply from very calm levels, but it is not yet unusually high.
Same Bitcoin Price, Very Different Options Pricing
February shows what real panic looks like in this market.
On Feb. 5, Bitcoin fell 14% in one session, from $72,998 to $62,791. DVOL jumped about 29 points that day and touched 90.3 intraday, as traders scrambled for downside protection.
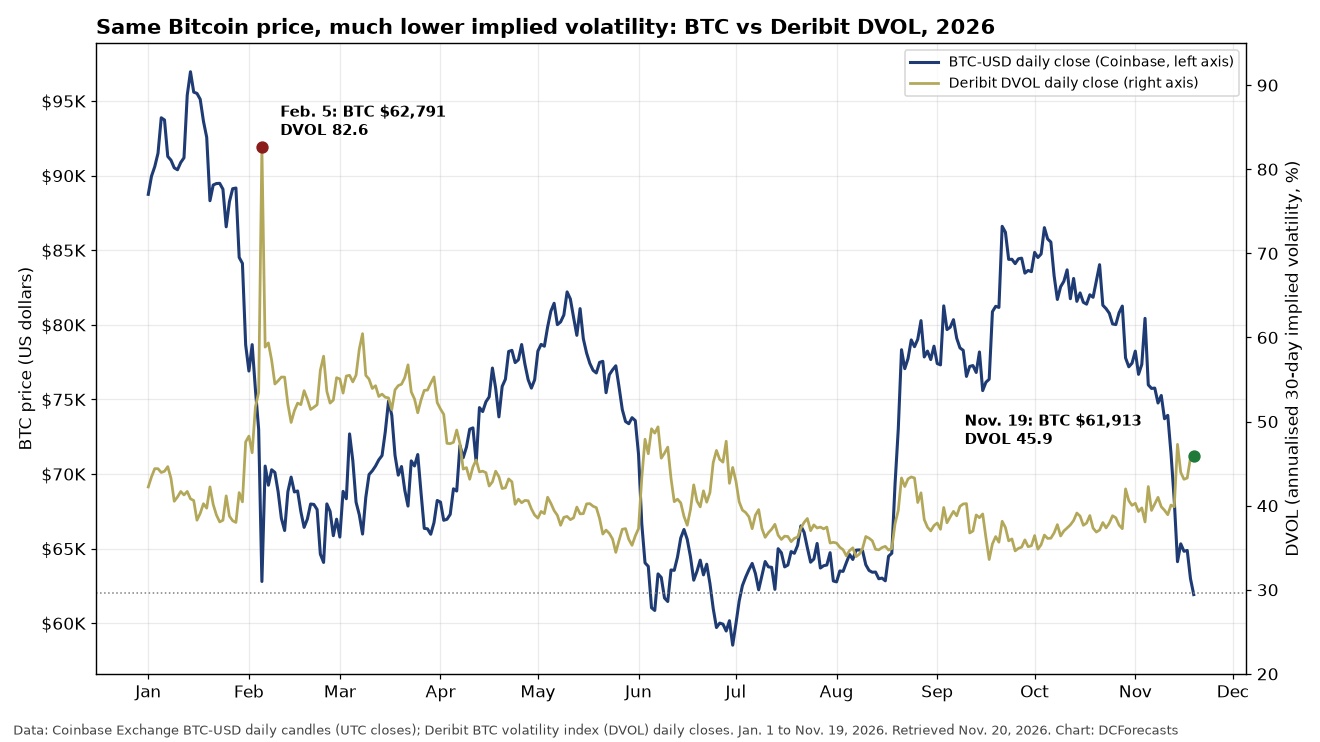
This time, the price reached the same zone over weeks rather than hours, a pattern we covered in our realised volatility analysis.
Implied and realised volatility are also close together. Bitcoin’s 30-day realised volatility, from Coinbase daily closes, was 44.0% on Nov. 19, just below DVOL’s 45.9 close.
That gap is small. Option sellers are charging only a slight premium over the swings Bitcoin has actually delivered.
Where the Options Curve Shows Stress
The curve across expiry dates shows where the demand is concentrated. In a Deribit snapshot at 13:47 IST on Nov. 20, at-the-money implied volatility was highest for the shortest contracts.
The Nov. 21 expiry was priced near 58.9%, the Nov. 27 expiry at 47.5% and the Dec. 25 quarterly at 45.1%. Contracts out to September 2027 sat near 42.9%.
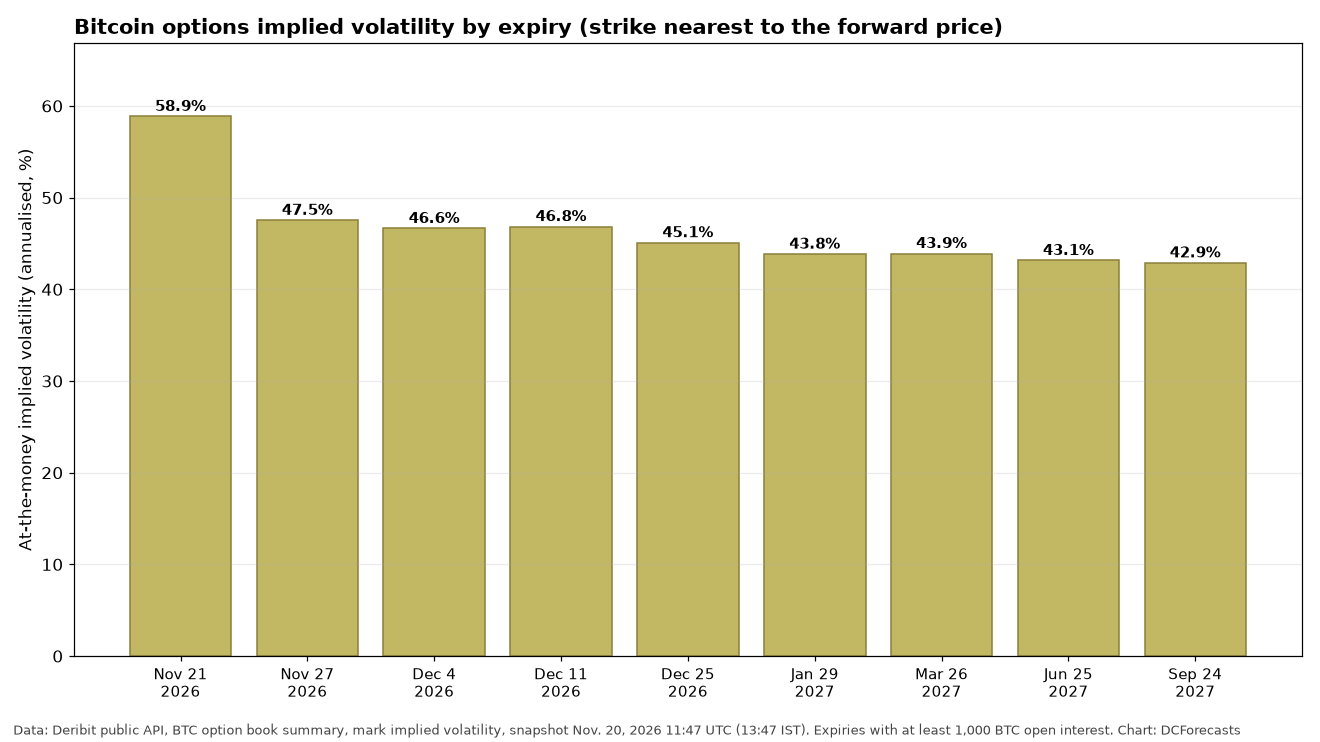
A downward-sloping curve means traders are paying more for protection in the coming days than over the coming months. That is a sign of caution, and it deserves respect.
Beyond the one-day contract, the slope is gentle. From Nov. 27 to September 2027, the curve spans less than five points, which suggests the market does not expect the stress to last.
The two biggest dates are close. Deribit showed about 105,000 BTC of open interest in the Nov. 27 expiry and about 153,000 BTC in the Dec. 25 quarterly. Strike-level positioning is in our look at the largest Bitcoin options bets.
Futures Premiums Stay Modest
The futures market looks orderly too. Deribit’s March 2027 contract traded about 1.8% above the Bitcoin index, roughly 5.3% annualised. The September 2027 contract was about 4.8% higher, about 5.7% a year.
Funding has stayed mostly positive. Binance’s BTCUSDT perpetual funding rate was positive in 55 of November’s 59 eight-hour periods so far, extending a pattern we tracked earlier this month.
Neither reading shows traders paying up aggressively for leveraged exposure in either direction.
Is Rising Implied Volatility a Warning or an Opportunity?
We believe it is mostly a sign of a market protecting itself rather than giving up.
Holders who buy puts or hedges can stay in their spot Bitcoin instead of selling it. Moderate option prices make that choice affordable, unlike in February, when protection cost far more.
Still, implied volatility does not predict direction, and it can jump fast, as Feb. 5 showed. We would watch three signals:
- DVOL holding below about 55, the area of its Nov. 15 intraday spike.
- A flatter curve after the Nov. 27 expiry, which would suggest near-term worries are fading.
- A daily close above $64,873, the Nov. 17 close, which would erase the Nov. 18 and Nov. 19 losses.
For now, the options market is pricing a bumpier few weeks, not a crisis. Bitcoin is back at February’s crash price without February’s fear.
With a fixed supply, deep derivatives markets and a growing base of institutional holders, Bitcoin has the structure to work through this stretch. If the hedging wave fades after the year-end expiries, that calm could become the platform for Bitcoin’s next move higher.
DC Forecasts is a leader in many crypto news categories, striving for the highest journalistic standards and abiding by a strict set of editorial policies. If you are interested to offer your expertise or contribute to our news website, feel free to contact us at [email protected]












Discussion about this post