



The Bitcoin selloff found a new floor on Friday, and it took Wall Street’s worst day in months to get there.
Bitcoin fell as low as $57,655 on Coinbase on Nov. 20, according to the exchange’s hourly price data. That slipped just under the July 1 low of $57,718, making it the lowest price since September 2024.
The drop did not happen in isolation. Tech stocks, gold and Bitcoin all fell hard on the same afternoon as investors rushed to cash.
For Bitcoin holders, the timing tells a story about where the pressure came from. It started in New York trading hours, not in crypto’s own markets.
The bigger question now is whether a forced, market-wide sale leaves Bitcoin closer to a durable low.
How the Bitcoin Selloff Unfolded on Friday
Bitcoin opened the UTC day at $61,912 and spent the morning in a tight range around $61,500 to $62,000.
That calm broke at 15:00 UTC, about half an hour after US stocks opened. The hour that followed saw roughly 4,939 BTC trade on Coinbase, about 4.5 times the previous hour, as the price slid below $59,400.
Selling came in waves after that. The low arrived during the 19:00 UTC hour, and by 21:00 UTC Bitcoin was changing hands near $58,340, down about 5.8% on the day.
That pattern stands out. Our earlier analysis found the recent selloff had hit hardest during Asian trading hours, while US sessions were roughly flat. On Friday, the trigger sat clearly in the US session.

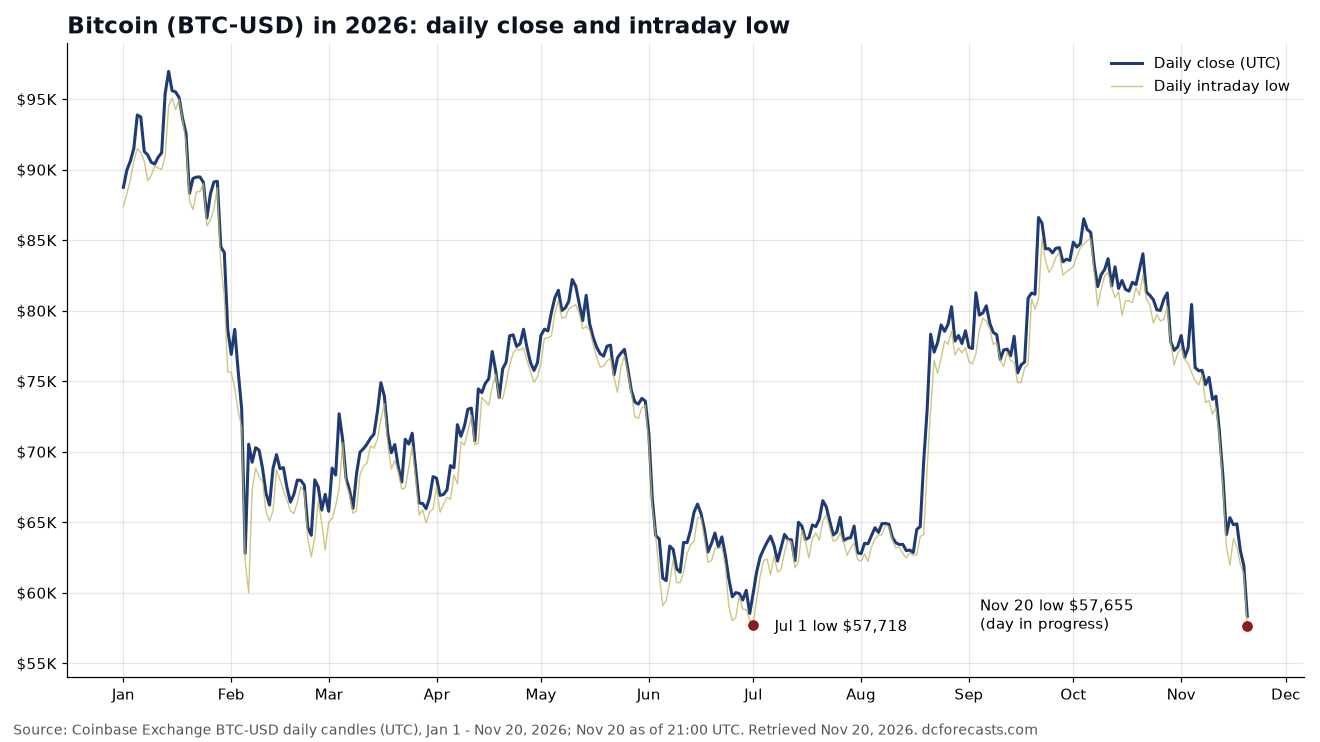
We flagged the slide toward this zone when Bitcoin’s daily close slipped under $62,000 on Thursday for the first time since early July. Friday’s move carried that test all the way down to July’s low, and marginally through it.
Why Wall Street Dragged Crypto Lower
The backdrop was a broad risk-off day. Based on preliminary closing data, the Nasdaq Composite fell about 5.3% and the S&P 500 lost roughly 3.7%.
That left the S&P 500 more than 11% below its Oct. 6 record close, deep in correction territory. The Nasdaq is now about 18% off its own Oct. 6 peak.
Worries about AI spending and valuations drove the move, with chip stocks among the hardest hit. Anthropic, which listed only on Thursday, also traded lower.
The Cboe Volatility Index jumped about 34% to near 38, its highest close in at least a year.
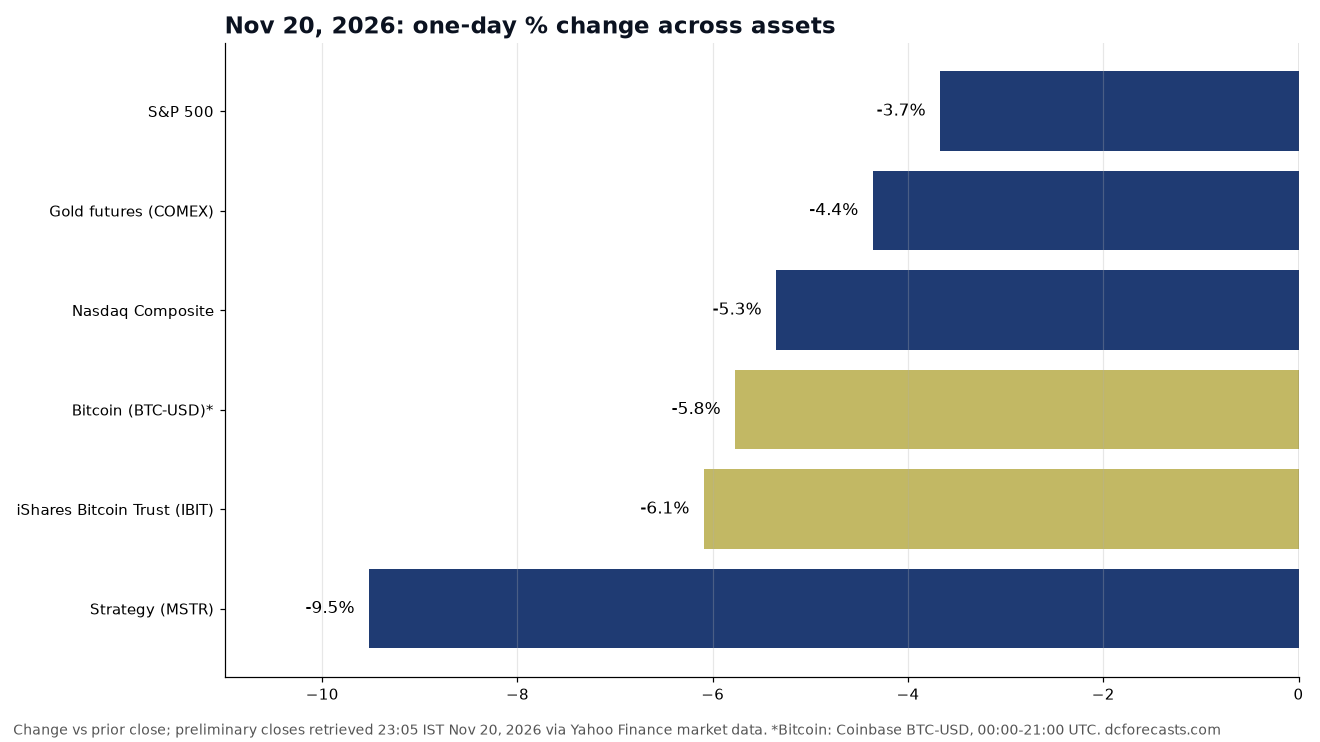
Bitcoin-linked stocks felt it too. Strategy shares fell about 9.5%, while BlackRock’s iShares Bitcoin Trust dropped around 6.1%.
That ETF weakness follows a heavy week of redemptions, including IBIT’s record $541 million one-day outflow.
Gold Fell Too. That Matters
The most telling detail may be gold. COMEX gold futures dropped about 4.4% on Friday, to roughly $3,525 an ounce.
When gold, tech stocks and Bitcoin all fall together, it usually points to a scramble for cash rather than a verdict on any single asset.
Funds facing losses and margin calls sell what they can, and liquid assets go first. Bitcoin trades around the clock, which makes it one of the easiest things to sell in a hurry.
We believe that is an important distinction. Nothing in Friday’s drop came from a failure inside Bitcoin’s network, a change to its supply or a problem at a major exchange.
The Rate Picture Is Shifting
There was one notable winner. US Treasuries rallied, and the 10-year yield fell about 14 basis points to roughly 4.91%.
That is a sharp turn from earlier in the week. Minutes from the Fed’s last meeting showed nearly every official expected more rate hikes, a backdrop that has weighed on risk assets all month.
If the equity slide deepens, markets may start to price out some of those hikes. Lower yields and a less aggressive Fed have historically been a friendlier setting for Bitcoin.
For us, this is one of the key signals to watch in the coming sessions, alongside ETF flows and the Nasdaq.
Can Bitcoin Hold Above Its 2026 Lows?
Sentiment is already at an extreme. The Crypto Fear & Greed Index read 12 on Friday, its eighth straight day in “Extreme Fear.”
Readings that deep often show up near periods of capitulation, though they do not mark a bottom on their own.
The first level to watch is the July zone near $57,700. A daily close back above $60,000 would require a gain of nearly 3% from Friday evening’s price and would turn the break into a brief undercut.
A move back to $62,000, where Bitcoin traded before the US open, would need a rise of roughly 6.3%.
The longer view also deserves attention. Our look at the halving cycle showed that in the last two cycles, Bitcoin’s bear-market low had already arrived by day 924 after the halving. This cycle passed day 943 on Thursday, and its peak landed right on the old schedule.
Bitcoin’s fixed 21 million supply has not changed, and the institutional plumbing built over the past two years, from spot ETFs to bank custody, remains in place. Long-term holders have seen this kind of fear before.
The coming days will reveal whether Friday was a capitulation flush or another step lower. If Bitcoin reclaims $60,000 as the stock market steadies, investors may start to see July’s low as a floor that held.
DC Forecasts is a leader in many crypto news categories, striving for the highest journalistic standards and abiding by a strict set of editorial policies. If you are interested to offer your expertise or contribute to our news website, feel free to contact us at [email protected]












Discussion about this post