



Bitcoin dominance looks stuck near 58% on the usual scoreboard, but that number is hiding a quiet record inside the crypto market.
Measured against the 10 largest non-stablecoin altcoins, Bitcoin’s share of market value hit 73.59% on Nov. 15, its highest reading in at least a year, according to our analysis of CoinGecko daily market capitalisation data. Early on Saturday, Nov. 21, it stood at 73.15%.
That has happened during a painful stretch. Bitcoin traded near $59,000 on Saturday, about 53% below its $126,080 record from Oct. 6, 2025, and CoinGecko showed the total crypto market down 7.2% in 24 hours.
For Bitcoin investors, the most useful signal is where the money that stays in crypto is choosing to sit.
The bigger question is whether that concentration can hold once fresh dollars return.
Why Bitcoin Dominance Looks Weaker Than It Is
The standard BTC dominance figure divides Bitcoin’s market value by the value of every tracked token, stablecoins included.
On Saturday, CoinGecko put Bitcoin at 57.87% of a $2.05 trillion market. Tether (USDT) took 8.49% and USD Coin (USDC) 3.33%.
Those two dollar tokens are designed to hold $1. When Bitcoin falls and they do not, their share rises automatically, and the headline dominance reading drifts lower even if nobody sells Bitcoin for an altcoin.
Strip out just USDT and USDC, and Bitcoin accounts for roughly 65.6% of what remains.

We believe that is a fairer read of how investors are treating Bitcoin against other volatile crypto assets.
Altcoins Lost 40% in a Year While Bitcoin Lost 30%
To track that relationship over time, we built a basket of the 11 largest non-stablecoin assets by market value: Bitcoin, Ether, BNB, XRP, Solana, Tron, Dogecoin, Cardano, Hyperliquid, Chainlink and Stellar.
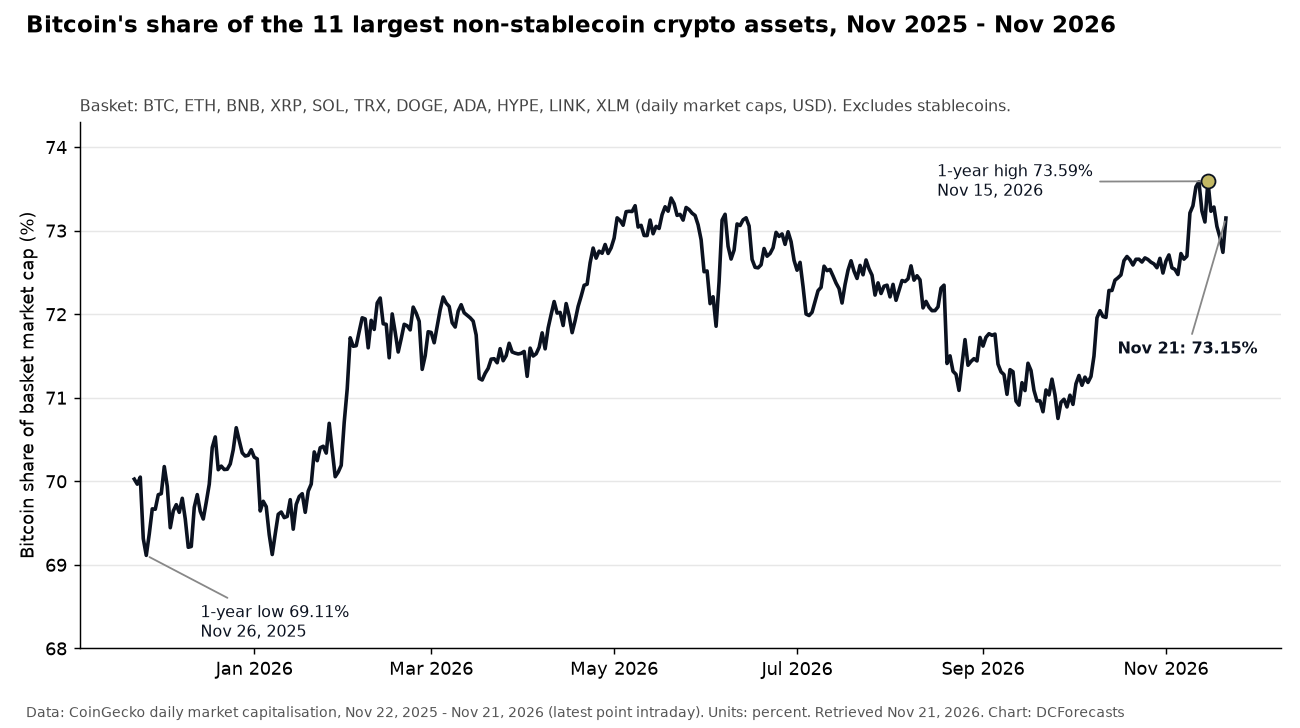
Over the past 365 days, Bitcoin’s market value fell about 30%, from roughly $1.70 trillion to $1.19 trillion.
The other 10 coins combined fell about 40%, from roughly $726 billion to $436 billion.
That gap lifted Bitcoin’s share of the basket from 70.03% a year ago, and from a low of 69.11% on Nov. 26, 2025, to this month’s peak.
The losses are real, and we will not dress them up. But the pattern is consistent: when liquidity drains, the largest and most liquid asset loses less.
The drawdowns from record highs tell the same story. CoinGecko data shows Ether 67% below its August 2025 peak, XRP 75% lower, Solana down 77% and Cardano down 95%, against Bitcoin’s 53%.
As we showed in our look at Bitcoin against Ether and other altcoins five years after the 2021 peak, the gap measured over a full cycle has been even wider.
The Stablecoin Market Cap Is Shrinking, Too
The second chart explains why the headline number and our basket measure are moving in different directions.
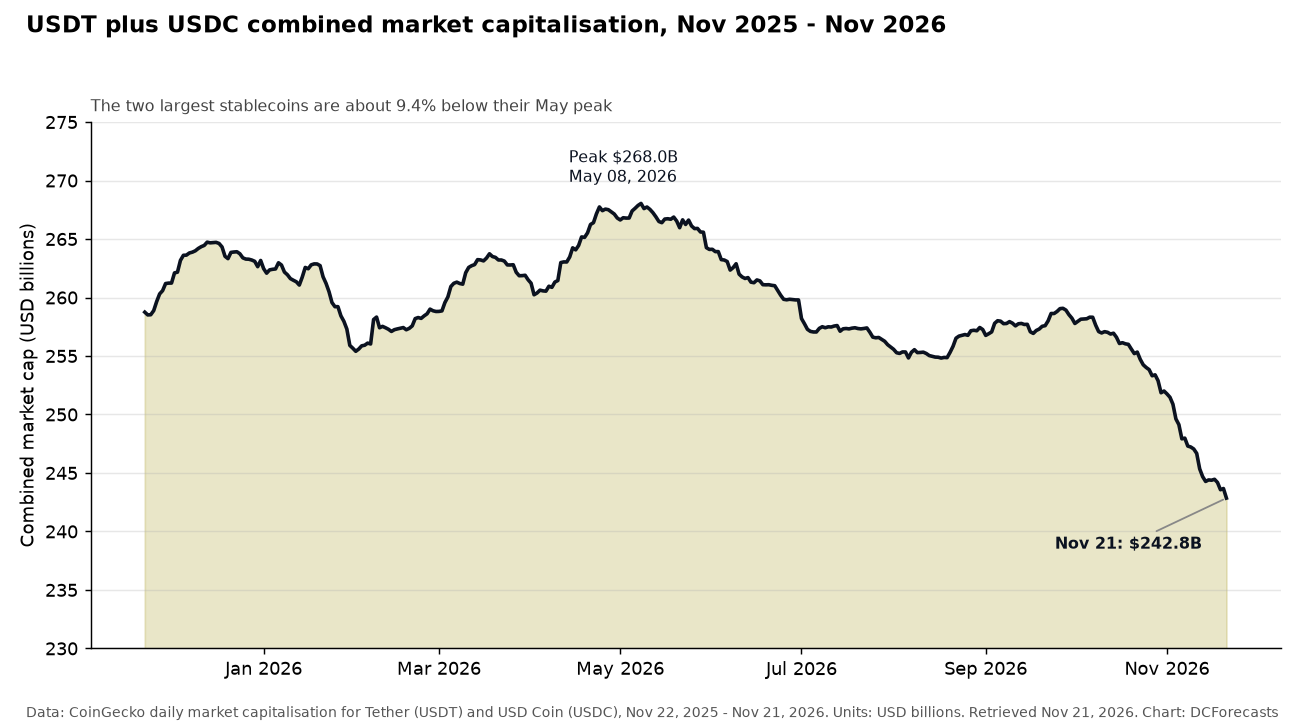
The combined stablecoin market cap of USDT and USDC peaked at about $268.0 billion on May 8, 2026. It now sits near $242.8 billion, 9.4% lower.
Most of that decline came recently. The pair still totaled about $258.3 billion on Oct. 6, so roughly $15.5 billion of combined market value has gone in about six weeks.
That is a genuine headwind. Stablecoins are the cash that usually funds the next round of buying, and less of it is parked on-chain today.
Yet the stablecoins’ share of the market still climbed, because Bitcoin’s value fell faster than the supply of dollar tokens. That mechanical effect is what is holding headline Bitcoin dominance near 58%.
What Pushed BTC Dominance Higher Since September?
Bitcoin’s share of the basket bottomed at 70.75% on Sept. 26, 2026. It then climbed for most of October and November.
Only five days in the past year closed at or above 73.3%: May 20 and 21, and Nov. 11, 12 and 15.
In other words, the selloff of recent weeks has been rougher on most large altcoins than on Bitcoin. Since Nov. 7 alone, Bitcoin’s market value has fallen about 22%, while the other 10 assets lost about 24%.
We read that as a flight to quality inside crypto. Investors trimming risk are cutting the smaller, more speculative positions first and keeping the asset with the deepest market and the clearest monetary policy.
That fits the timing in our halving-cycle analysis, which puts Bitcoin at day 943 of the current cycle, past the point where the last two bottoms formed.
What Would Confirm Bitcoin’s Lead From Here?
We would watch three things in the coming weeks.
- Whether Bitcoin’s basket share can hold above 73% as prices try to stabilise, rather than slipping back toward the 71% area seen in September.
- Whether the USDT and USDC market cap stops shrinking. A turn higher would signal fresh dollars arriving, the kind of cash that typically funds new buying.
- Whether altcoins bounce harder than Bitcoin on relief rallies. Short bursts are normal; a sustained catch-up would be the real change.
For us, the key takeaway is simple. Headline Bitcoin dominance understates how firmly investors are choosing Bitcoin over the rest of the crypto market.
With a fixed 21 million supply, deepening institutional infrastructure and a growing share of crypto’s non-dollar value, Bitcoin enters this drawdown as the market’s anchor rather than its weak link.
The coming weeks will reveal whether returning stablecoin dollars follow that lead.
DC Forecasts is a leader in many crypto news categories, striving for the highest journalistic standards and abiding by a strict set of editorial policies. If you are interested to offer your expertise or contribute to our news website, feel free to contact us at [email protected]












Discussion about this post